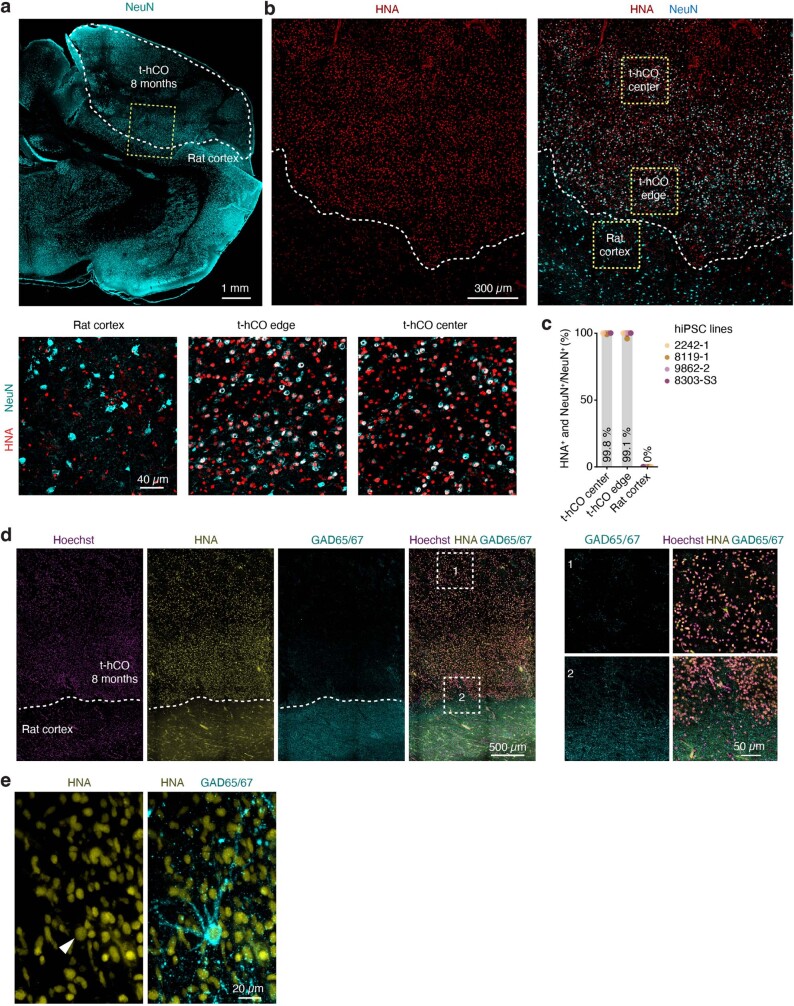
Extended Data Fig. 2. Immunohistochemical characterization of t-hCO.
a–b. NeuN expression in t-hCO and the surrounding rat brain. c. Quantification of the overlap of HNA and NeuN expression in t-hCO and rat cortex (n = 5 t-hCO from 4 hiPS lines, 1–2 t-hCO per line). d. Representative images of GAD65/67 expression in t-hCO-rat cortex border. e. Example image of a rarely observed HNA+GAD65/67+ neuron in t-hCO. All images were acquired 8 months after transplantation unless otherwise stated.

