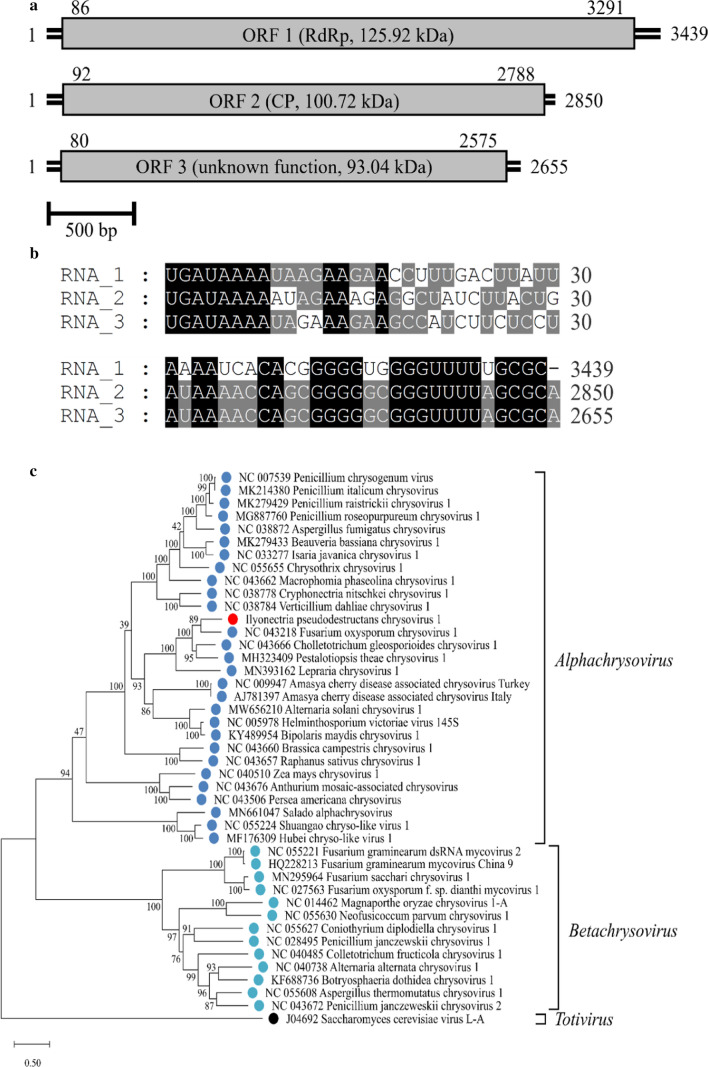
Fig. 1.
a Scaled genome map of IpCV1. Numbers represent nucleotide positions of the 5’ ends, ORFs, and 3’ ends. Boxes represent ORFs, with the encoded protein indicated. b Alignment of 5’- and 3’-UTRs. Numbers next to the sequences represent nucleotide positions. Mapped with GeneDoc 2.7. c Maximum-likelihood tree based on RdRp aa sequences of chrysoviruses and a totivirus, constructed in MEGA X with 1000 bootstrap replicates, the Le_Gascuel_2008 substitution model with gamma-distributed rates, invariant sites, and empirical base frequencies (LG+G+I+F). For the alignment, the MUSCLE algorithm was used with default parameters (gap opening, -2.9; gap extension, 0) [8, 10, 11]

