
Figure 2.
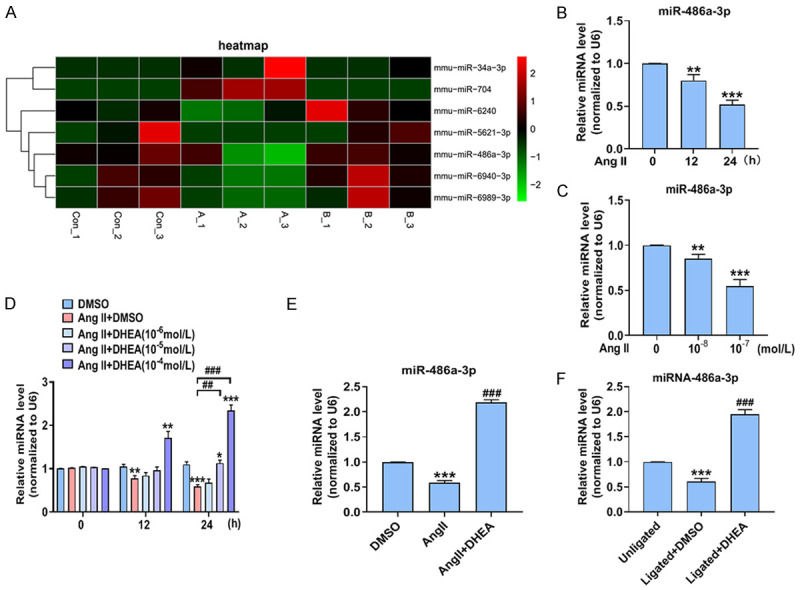
DHEA upregulates miR-486a-3p expression in VSMCs and vascular intima. (A) VSMCs were incubated with DMSO, Ang II (10-7 mol/L), or Ang II (10-7 mol/L) plus DHEA (10-4 mol/L) for 24 h. MiRNA microarray analysis was performed to compare the miRNA expression profiles. (B, C) VSMCs were treated as in Figure 1H and 1I, and qRT-PCR was performed to determine miR-486a-3p expression. **P < 0.01 and ***P < 0.001 vs. 0 h group or 0 mol/L Ang II group. (D) VSMCs were treated as in Figure 1J; qRT-PCR was used to measure miR-486a-3p expression. *P < 0.05, **P < 0.01, and ***P < 0.001 vs. DMSO group, ##P < 0.01 and ###P < 0.001 vs. Ang II group. (E) VSMCs were treated as in (A); qRT-PCR was used to determine miR-486a-3p expression. ***P < 0.001 vs. DMSO group, ###P < 0.001 vs. Ang II group. (F) qRT-PCR was performed to determine miR-486a-3p expression in the carotid arteries 14 days after ligation. ***P < 0.001 vs. unligated group, ###P < 0.001 vs. ligated + DMSO group.