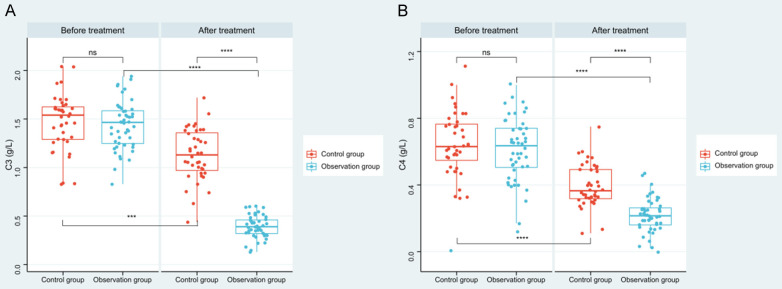
Figure 1.
Changes of C3 and C4 in patients before and after treatment. A. Comparison of changes in C3 levels before and after treatment between the two groups. B. Comparison of changes of C4 levels before and after treatment between the two groups. Note: ns indicates P>0.05; *** indicates P<0.001; **** indicates P<0.0001. complement 3 (C3), complement 4 (C4).

