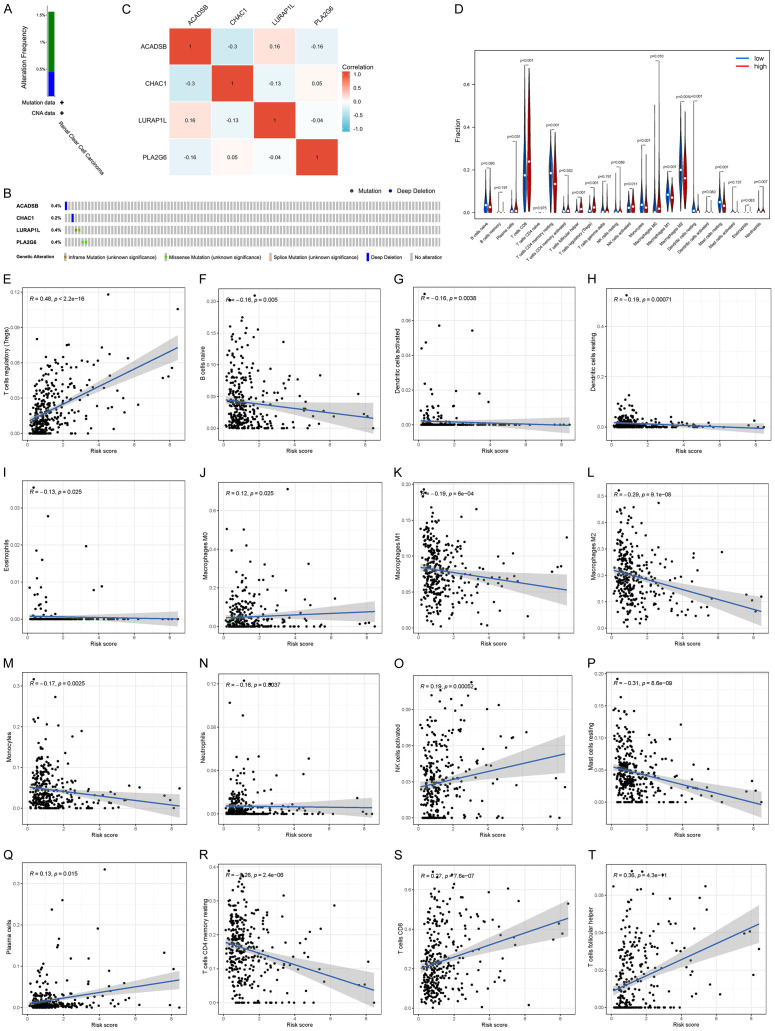
Figure 7.
Mutation and correlation analysis of four model genes in KIRC. A. Mutation frequency of model genes. C. Correlation between each of the two model genes. B. Mutations of each model gene in each sample. D. Analysis of tumor infiltrating cells in patients at high and low risk. Violin plot of the abundance of 22 immune cells in the risk group. The x-axis represents 22 types of immune cells, and the y-axis represents the relative abundance of immune cells. E-T. Relationship between risk score and immune cells. KIRC, clear cell carcinoma of kidney.

