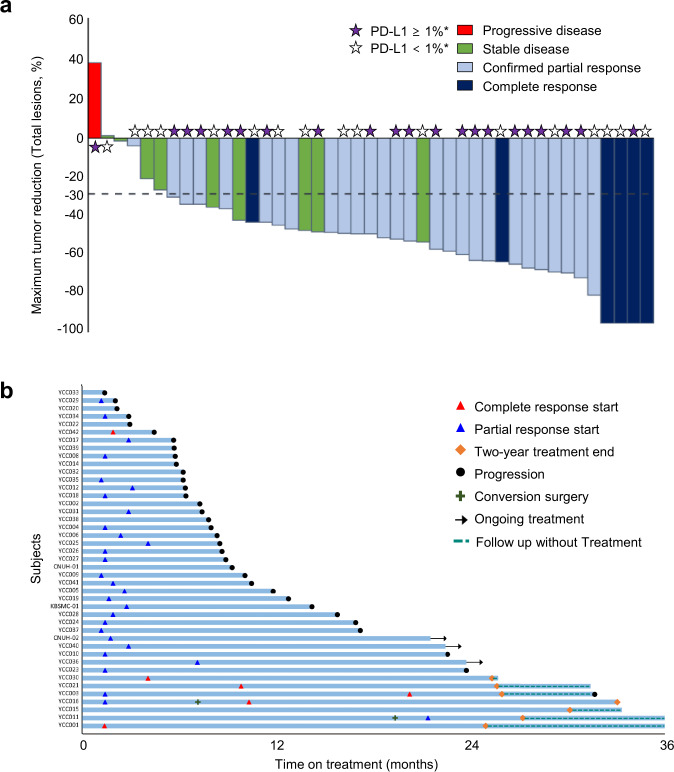
Fig. 2. Tumor reduction in total lesions and tumor response.
a Maximum percentage change from baseline in the size of total (target + non-target) tumor lesions with the corresponding best responses based on RECIST 1.1 criteria and the PD-L1 CPS from baseline tissue in all patients. The lower dotted line represents a 30% tumor reduction (n = 43). b A swimmer plot showing outcomes in all patients from the start of treatment to either disease progression or the last follow-up (n = 43). Note that seven patients received treatment for 2 years. CPS, combined positive score; PD-L1, programmed death-ligand 1; RECIST, Response Evaluation Criteria in Solid Tumors.

