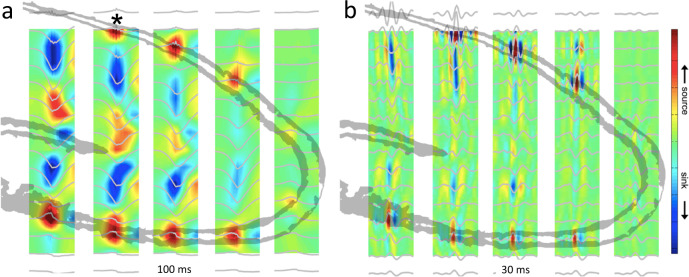
Fig. 1. Depth profile of SPW-Rs in the hippocampal CA1-dentate axis.
a Recording with a 6-shank, 96-site linear silicon probe spanning hippocampal regions and layers in a rat (5-shanks are shown, each with 16 sites with 100 µm vertical separation). Average current source density (CSD, color) maps and superimposed LFP traces of SPW-R events (100 ms, gray) from all recording sites. Asterisk indicates reference site. Note negative sharp waves and sinks (blue) in the stratum radiatum of CA1 and CA3 and the inner molecular layer of the dentate gyrus. b Same as in (a) but the maps were constructed from the filtered signal (50–250 Hz; 30 ms long traces). Red, source; blue, sink. Reproduced from ref. 25, CC BY-NC-SA 3.0 (https://creativecommons.org/licenses/by-nc-sa/3.0/).

