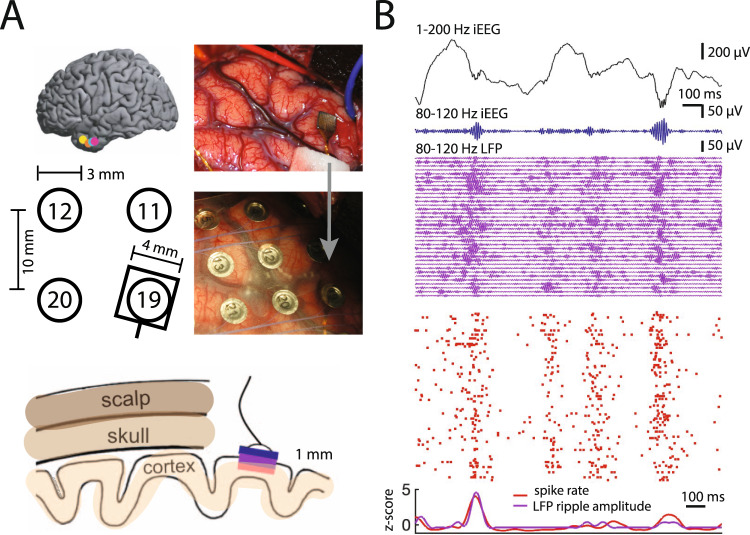
Fig. 4. Relationship between cortical ripple amplitude and local spiking.
A Locations of the microelectrode arrays with respect to four nearby iEEG channels in one participant (bottom left). Right, Intraoperative photo of implanted array in the anterior temporal lobe before and after placement of an iEEG grid over the it. Bottom, Schematic of scalp, skull and cortex with respect to one iEEG channel on the cortical surface and one array in cortex. B 1500 ms window of 1–200 Hz iEEG signal (black), 80–120 Hz band iEEG signal (blue), 80–120 Hz band LFP signals across all MEA electrodes (purple), and raster plot for sorted units (red). Reprinted from ref. 73.

