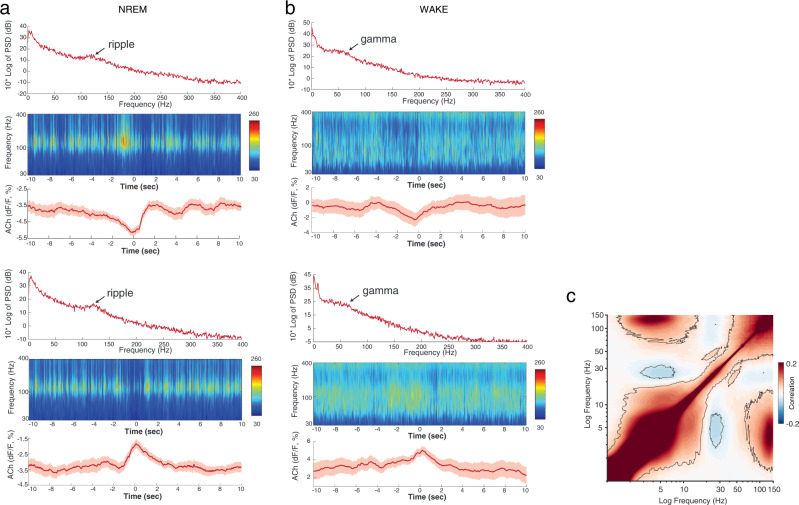
Fig. 6. Relationship between Ach levels in the hippocampus and SPW-R/gamma power.
a Power spectrum (0–400 Hz) and time-resolved power spectrum (40–400 Hz) of the LFP recorded from the CA1 pyramidal layer of a mouse, centered at the natural fluctuations of Ach levels (troughs and peaks, respectively). b Same as in b but during waking. Note the absence of ripples (>100 Hz) during Ach peaks, whereas highest gamma power (40–120 Hz) is present at the highest levels of Ach release. Note also the different calibration of the power panels and averaged Ach signal. Based on >50 average epochs. c Average cross-frequency power comodulogram of the LFP from the CA1 pyramidal layer in a macaque. Note the inverse correlation between ripple and beta/gamma (20–80 Hz) frequency bands. a, b Reproduced from ref. 7, and c reproduced from ref. 140, CC BY-ND 4.0 (https://creativecommons.org/licenses/by-nd/4.0/).

