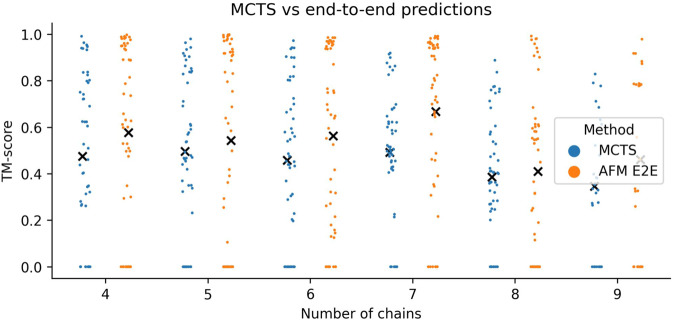
Fig. 5. Comparison of assembly with MCTS vs. AlphaFold-multimer on complexes with 4–9 chains.
Swarm plots displaying the TM-scores (n = 278, n = 50 for each oligomer except for the nonamers, which have n = 28) for assemblies using all possible trimers predicted with FoldDock (MCTS) and AFM end-to-end (E2E). Each point represents one complex with the mean TM-scores marked by a black “x”. The points at zero for MCTS are those complexes that could not be assembled to completion (n = 62) and those for AFM E2E that were out of memory (n = 67). The averages are 0.47 vs 0.58, 0.50 vs 0.54, 0.46 vs 0.56, 0.49 vs 0.67, 0.39 vs 0.41 and 0.35 vs 0.46 for AFM E2E vs MCTS 4–9 chains, respectively.

