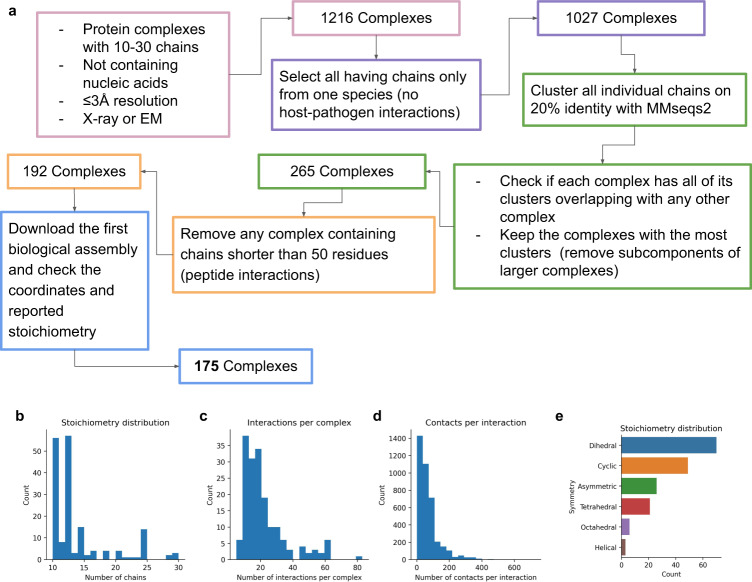
Fig. 6. Data selection process and statistics.
a Outline of the data selection process. b Distribution of the number of chains for the 175 complexes. Most complexes have 10–12 chains. c Distribution of the number of interactions between all chains in a complex (n = 175 complexes). On average, there are 22 interactions per complex. d Distribution of the number of contacts per interaction (n = 175 complexes). On average, there are 70 contacts per pair of interacting chains. e Distribution of the symmetry types of the complexes (n = 175 complexes). Dihedral complexes are the most common, followed by cyclic and asymmetric.

