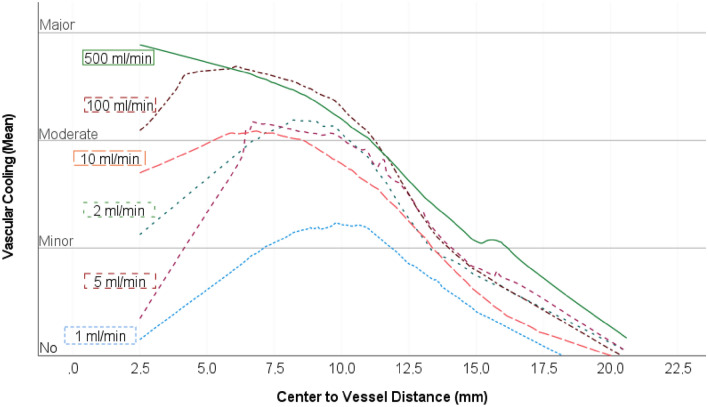
Figure 3.
Local regression curves (LOESS; comparable to Fig. 4) depending on the flow rates (1–500 ml/min). The averaged individual values, which are the basis of the regression analysis, have been omitted for visual clarity. No or minor cooling effects could be demonstrated for the test series with a perfusion rate of 1 ml/min. From a flow rate of 2 ml/min, moderate cooling effects occurred at a distance of 7.5 mm from the ablation centre in all test series. Moderate to severe cooling effects occurred at the ablation centre above a flow rate of 10 ml/min.

