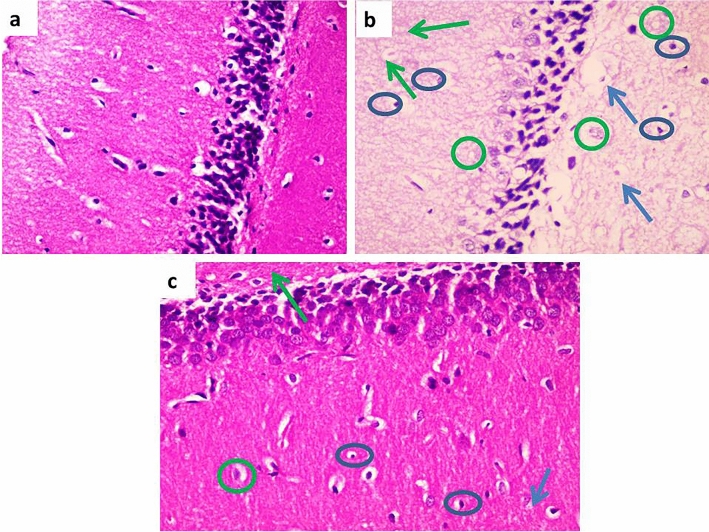
Figure 7.
Effect of metformin on hippocampal tissue structure in D-galactose induced-aging rat model. (a) Section of the hippocampal tissue in the control group showed unremarkable pathological changes. (b) Section of the hippocampal tissue in the D-gal group showed many neuronal degeneration (green circles), and apoptotic bodies (blue circles) with massive oedema (blue arrows) and gliosis (green arrows). (c) Section of the hippocampal tissue in the D-gal + Met group showed few neuronal degeneration (green circles) and few apoptotic bodies (blue circles) with mild oedema (blue arrows) and mild focal gliosis (green arrows). (H&E × 200 for A, B and C). (Number of rats = 10/group).

