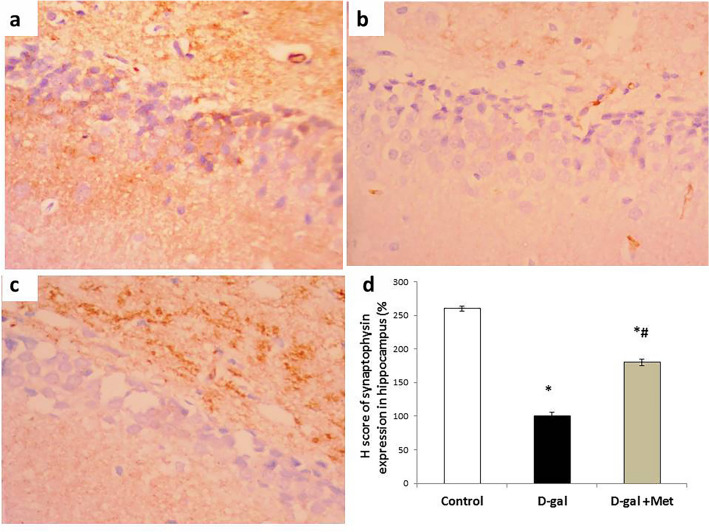
Figure 8.
Synaptophysin immunostaining in hippocampal tissues of the studied groups. (a) Section of the hippocampal tissue in the control group showed intense cytoplasmic expression of synaptophysin in neural cells. (b) Section of the hippocampal tissue in the D-gal group showed mild cytoplasmic expression of synaptophysin in neural cells. (c) Section of the hippocampal tissue in the D-gal + Met group showed moderate cytoplasmic expression of synaptophysin in neural cells (Synaptophysin × 200 for A, B and C). (d) Represents the percentage of synaptophysin expression in the above-mentioned groups (*significant when compared to control group, #significant when compared to D-gal group). Data are shown as means + SD (n = 10). ANOVA was used to make group comparisons; Significance = P < 0.05).

