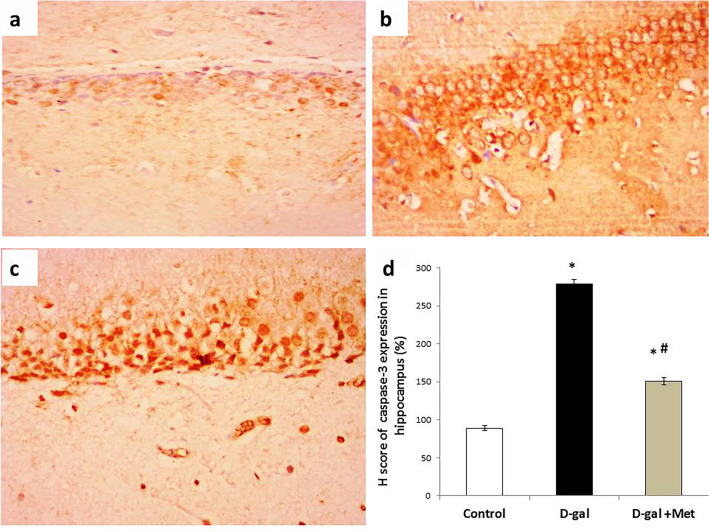
Figure 9.
Caspase-3 immunostaining in hippocampal tissues of the studied groups. (a) Section of the hippocampal tissue in the control group showed mild cytoplasmic expression of Casepase-3 in glial and neural cells. (b) Section of the hippocampal tissue in the D-gal group showed marked cytoplasmic expression of synaptophysin in neural cells. (c) Section of the hippocampal tissue in the D-gal + Met group showed moderate nucleocytoplasmic expression of Casepase-3 in neural cells (Casepase-3 × 200 for A, B and C). (d) Represents the percentage of Casepase-3 expression in the above-mentioned groups (*significant when compared to control group, #significant when compared to D-gal group). Data are shown as means + SD (n = 10). ANOVA was used to make group comparisons; Significance = P < 0.05).

