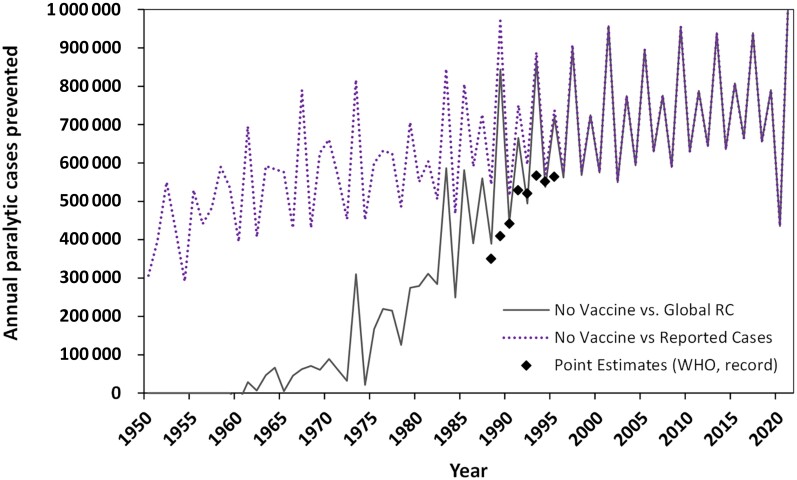
Figure 4.
Estimated total annual paralytic polio cases prevented since 1950 using the no vaccine scenario compared to either the global RC (solid black curve) or the reported cases (dotted purple curve). Black diamonds show WHO published point estimates of the paralytic polio cases prevented for the years 1988 to 1995 [31, 32, 37–42–38–42]. Abbreviations: RC, reference case; WHO, World Health Organization.

