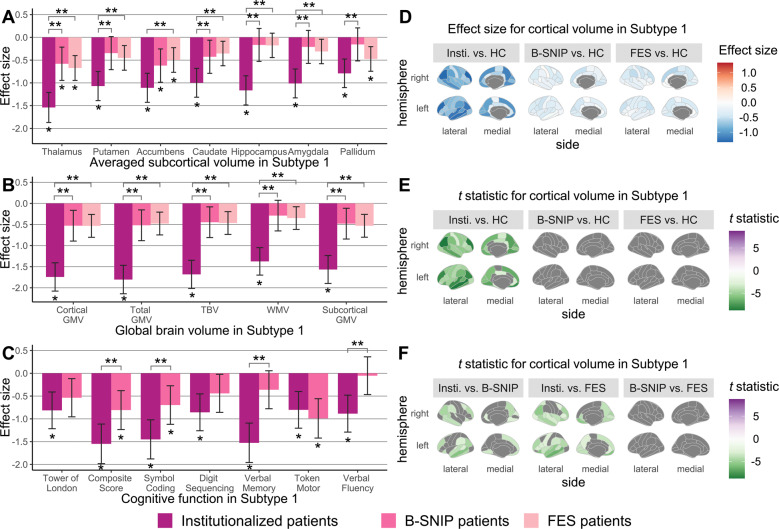
Fig. 3. Between-sample comparisons in brain-behavior profiles for Subtype 1.
ANCOVA and post hoc Tukey HSD tests were employed to test between-sample differences in (A) averaged subcortical volumes, (B) global brain volumes, (C) cognitive function, and (D–F) cortical volumes between Subtype 1 patients from different samples and the pooled healthy control group. Age, sex, and ICV were included as covariates for harmonized brain volumes, while education level was treated as the covariate for age- and sex-corrected BACS z-scores. In bar charts, significant patient-control and between-sample differences, determined by FDR-corrected P-values generated in post hoc pairwise tests, are marked by one and two asterisks, respectively. Shading bars represent Glass’s delta (Δ) effect sizes, which were calculated after removing variance related to covariates and used to demonstrate patient-control differences. Error bars mean 95% confidence interval of Δ. In cortical statistic maps, only regions that survived FDR corrections are colored by t statistics from post hoc tests. GMV Gray matter volume; HC Healthy controls; Insti. institutionalized patients; TBV Total brain volume; WMV White matter volume.

