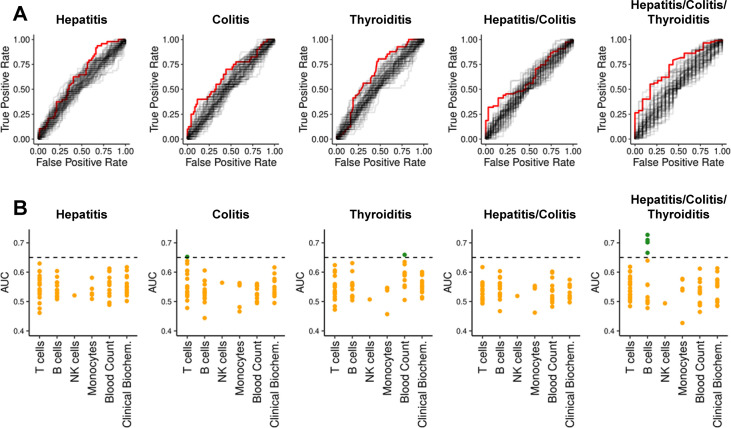
Figure 1.
ROC-curves and AUCs for previously reported biomarkers and clinical parameters per condition. (A) ROC-curves for all 68 features regarding each dependent variable are shown. For each dependent variable, the features with highest AUC is highlighted in red. (B) AUCs from ROC-curves in subfigure (A) grouped according to immunological classes. The y-axis represents the AUC. Orange dots denote AUC ≤ 0.65; green dots denote AUC > 0.65.

