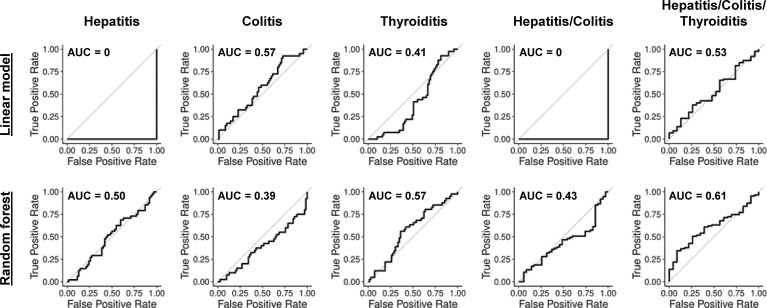
Figure 2.
ROC-curves for linear models and random forests with previously reported biomarkers and clinical parameters. ROC-curves in LOOCV for penalized logistic regression and random forest models predicting hepatitis (AUC 0 and 0.50), colitis (AUC 0.57 and 0.39), thyroiditis (AUC 0.41 and 0.57), hepatitis and/or colitis (AUC 0 and 0.43) and hepatitis and/or colitis and/or thyroiditis (AUC 0.53 and 0.61).

