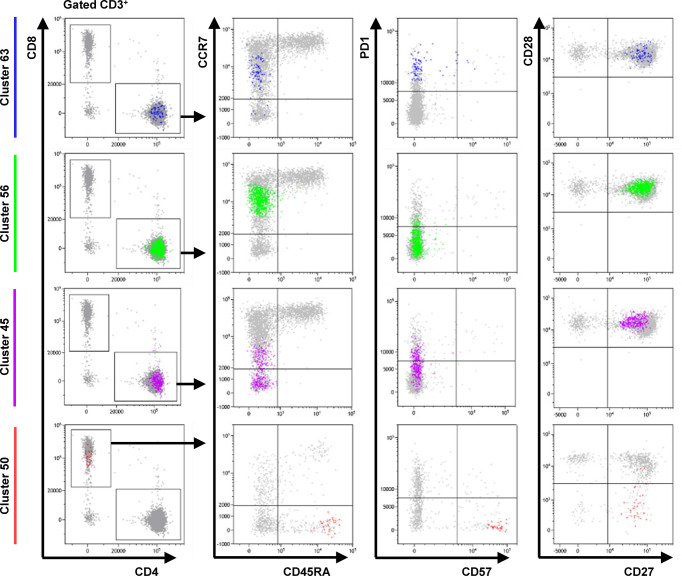
Figure 3.
Phenotype of cells in FlowSOM clusters associated with colitis. Dot plots show the phenotype of the cells in each cluster (color) and all gated cells for reference (grey). Clusters 63 and 56 are CD4+ CD45RA- CCR7int CD27+ CD28+ CD57- T cells that differ only in expression of PD-1. Cluster 45 is CD4+ CD45RA- CCR7low/- PD-1int CD27+ CD28+ CD57- T cell population. Cluster 50 represents a CD8+ CD45RA+ CCR7- CD27+ CD28- PD-1- CD57+ TEMRA subpopulation. Data from one representative patient.

