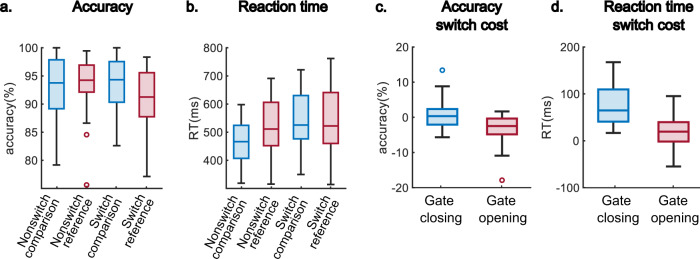
Fig. 1. Behavioral results for gate opening and gate closing.
Behavioral results derive from N = 33 participants. Plots a and b reveal the accuracy and reaction time (RT) in each condition, respectively. Plots c and d show the switching costs of accuracy and RT. For each box, the central line indicates the median value, the bottom edge of the box indicates the 25th percentiles, and the top edge indicates the 75th, and each dot represents an outlier identified by Matlab’s ‘boxchart’ function.

