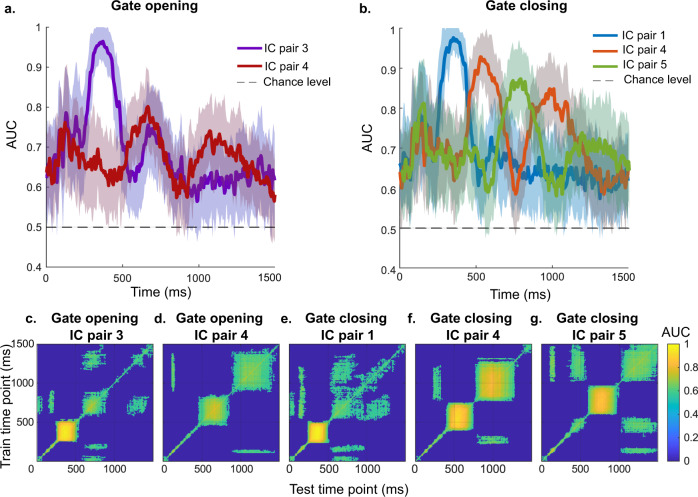
Fig. 3. MVPA results for selected independent component (IC) pairs of gating conditions.
Plots a and b show the binary classification performance of gate opening and closing conditions separately. The shaded error bars represent standard deviation. Plots c–g illustrate the temporary generalization of each IC pair. Only time points with significant (p < 0.05) classification performance computed by cluster-based permutation test with N = 33 samples are presented in color.

