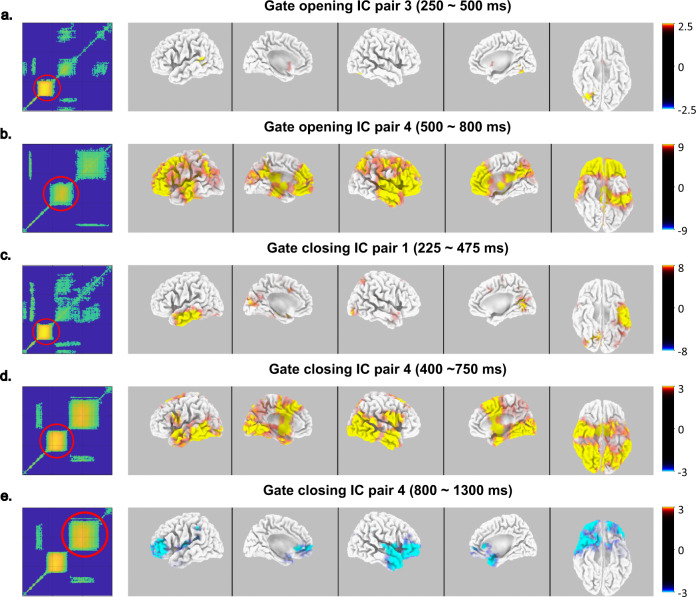
Fig. 4. Source localization of working memory gating dynamics.
The title indicates the independent component (IC) pair and the time window selected for sLORETA analysis for each plot (a–e). The temporal generalization result of this IC pair is presented on the left in each plot from (a) to (e) with a red circle marking the cluster utilized for sLORETA. The source of the working memory gating dynamics is illustrated from five orientations (from left to right: lateral-left, medial-left, lateral-right, medial-right, and bottom) presented on the right in each plot from (a) to (e). The color bar represents the critical t-values using N = 33 samples. The color key on the right of each plot from (a) to (e) denotes t-values.

