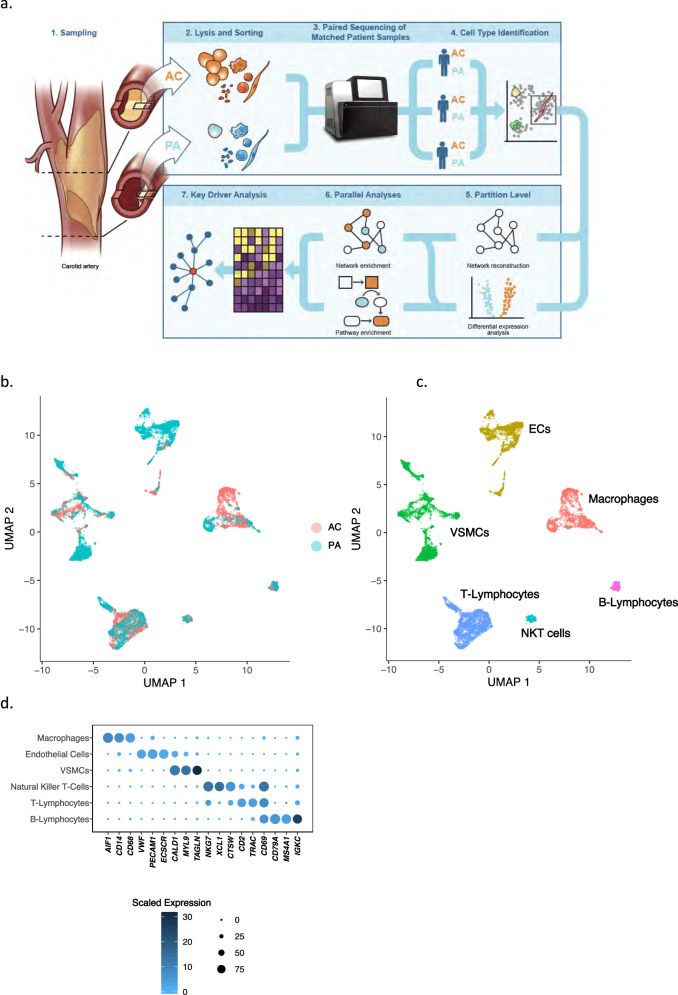
Fig. 1. Data processing produces 6 main cell group partitions.
a Schematic diagram of analytical steps from tissue dissociation to key driver analysis. b, c UMAP visualization of 6 major cell types following doublet removal via gene exclusion criteria (see Supplemental Methods), separated by anatomic location (b), and by cell type (c). d Dotplot depicting cell-type marker genes, resulting in the identification of macrophages, ECs, VSMCs, NKT cells, T- and B-Lymphocytes. Dot size depicts the fraction of cells expressing a gene. Dot color depicts the degree of expression of each gene. n = 3 for PA and AC groups.

