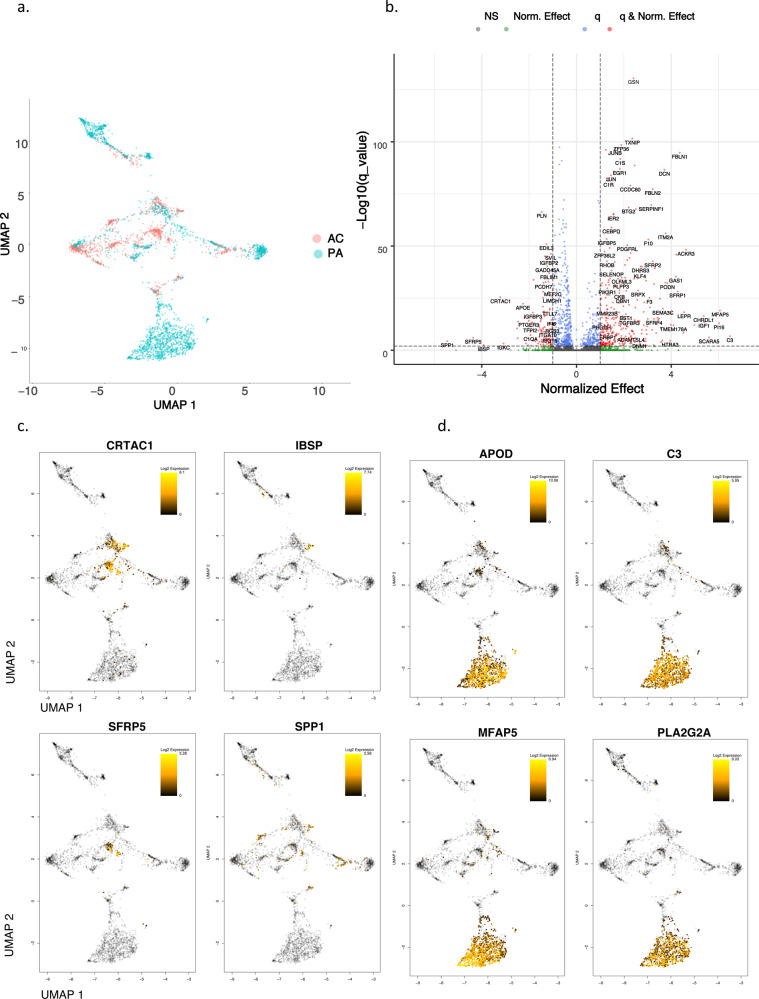
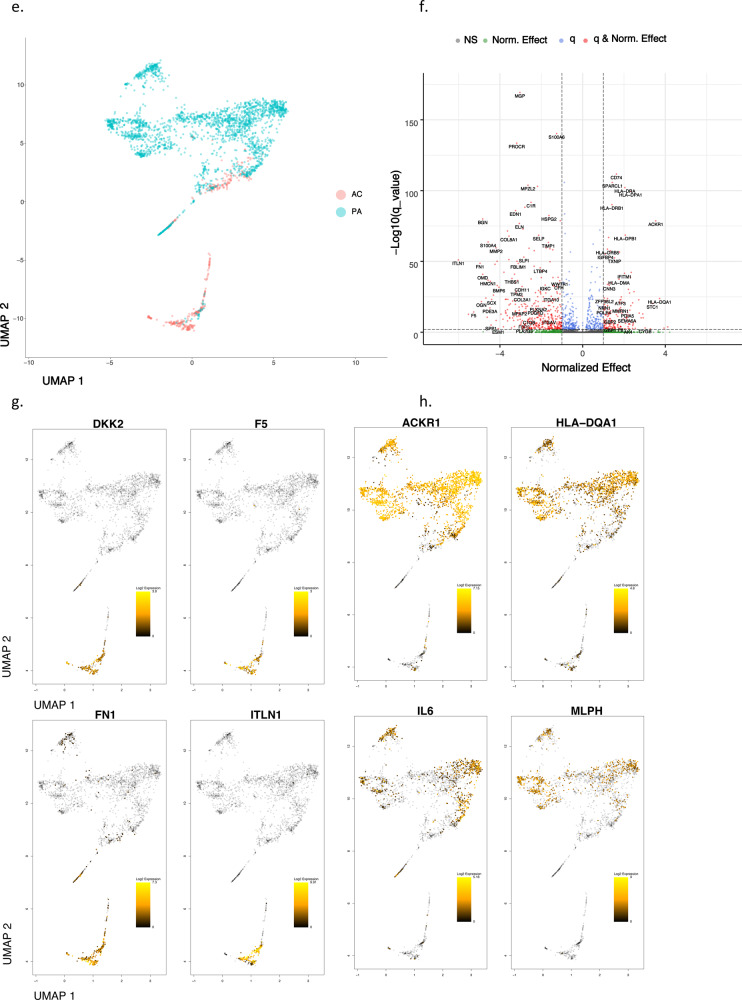
Fig. 2. Differential gene expression in VSMCs and ECs.
a, e UMAP visualization of VSMCs (a) and ECs (e), separated by anatomic location. b, f Volcano plots of the top differentially expressed genes in VSMCs (b) and ECs (f). Dotted lines represented q-value 0.5 and <−0.5 corresponding to PA and AC cells, respectively. c, d UMAP visualization of the top 4 upregulated genes in AC VSMCs (c), and PA VSMCs (d). Gray-colored cells indicate 0 expression of designated gene, while color bar gradient indicates lowest (black) to highest (yellow) gene expression level. g, h UMAP visualization of the top 4 upregulated genes in AC ECs (g), and PA ECs (h). Color scheme is similar to the above-described parameters. VSMCs = 3674 cells; ECs = 2764 cells. n = 3 for PA and AC groups.


