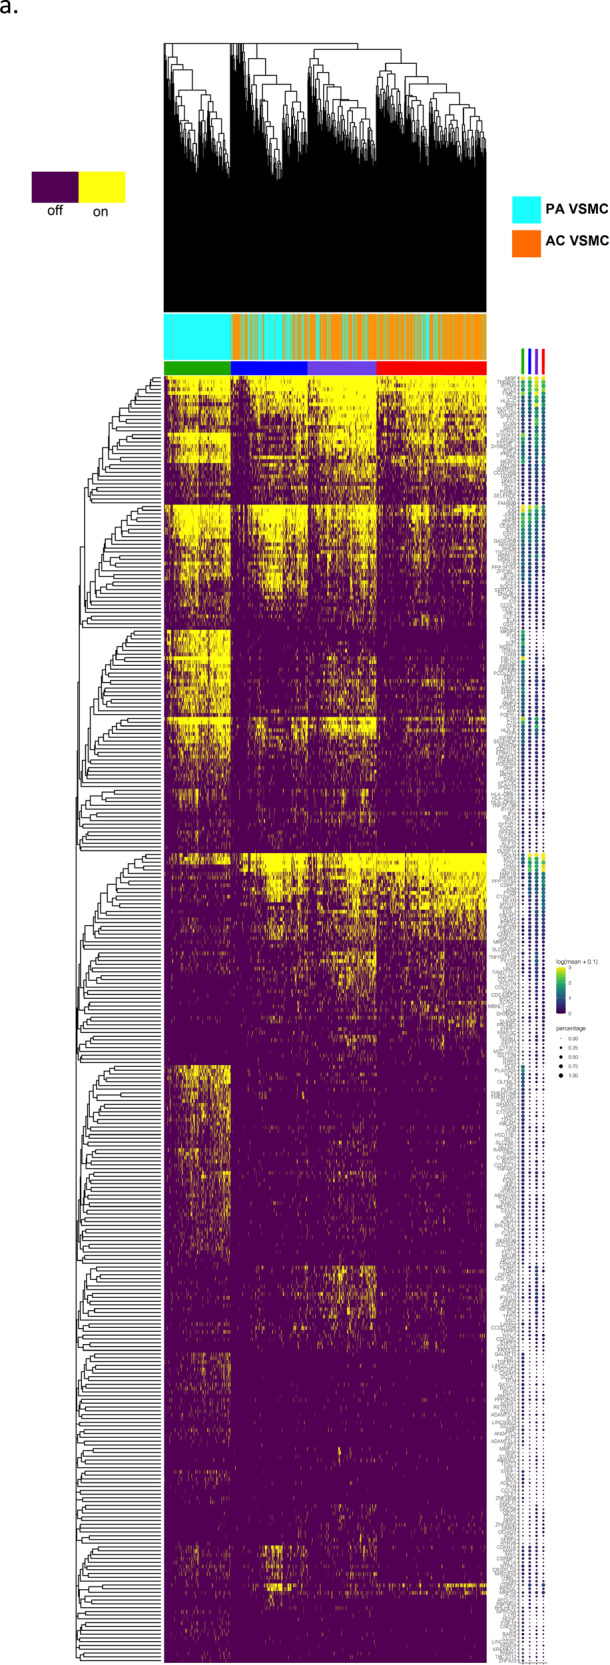
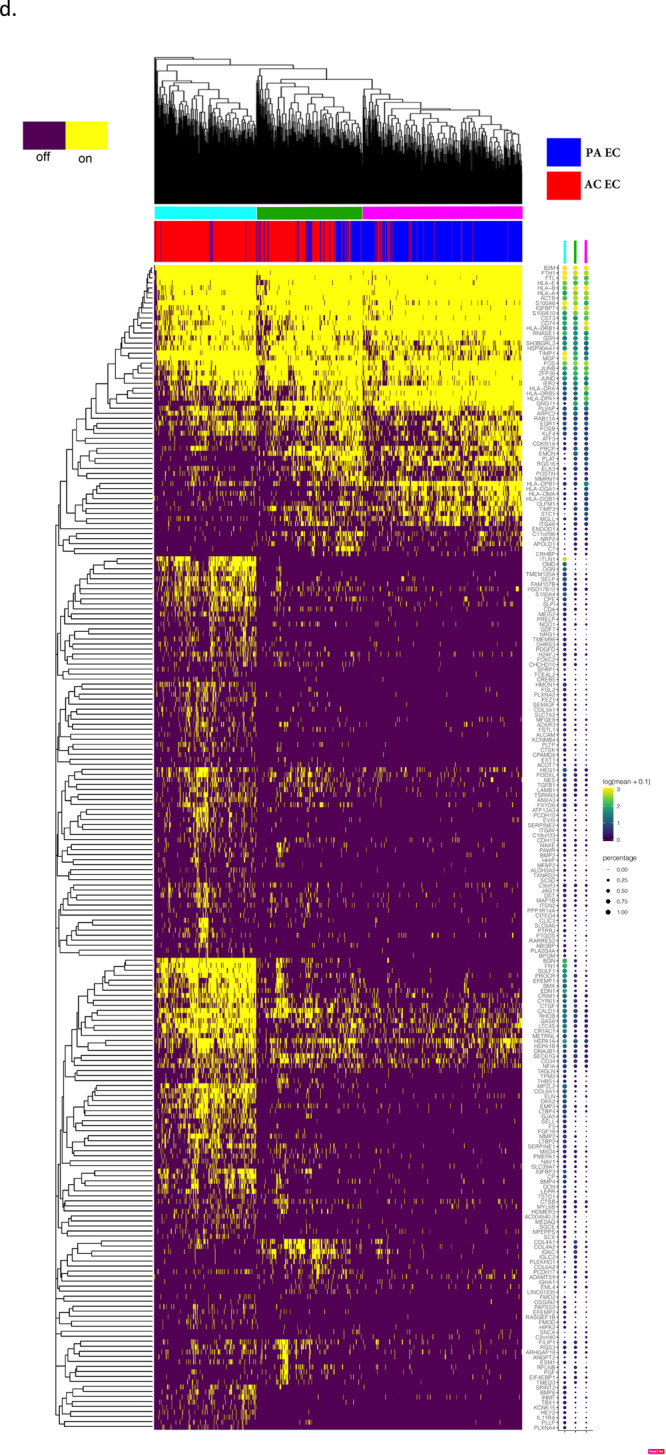
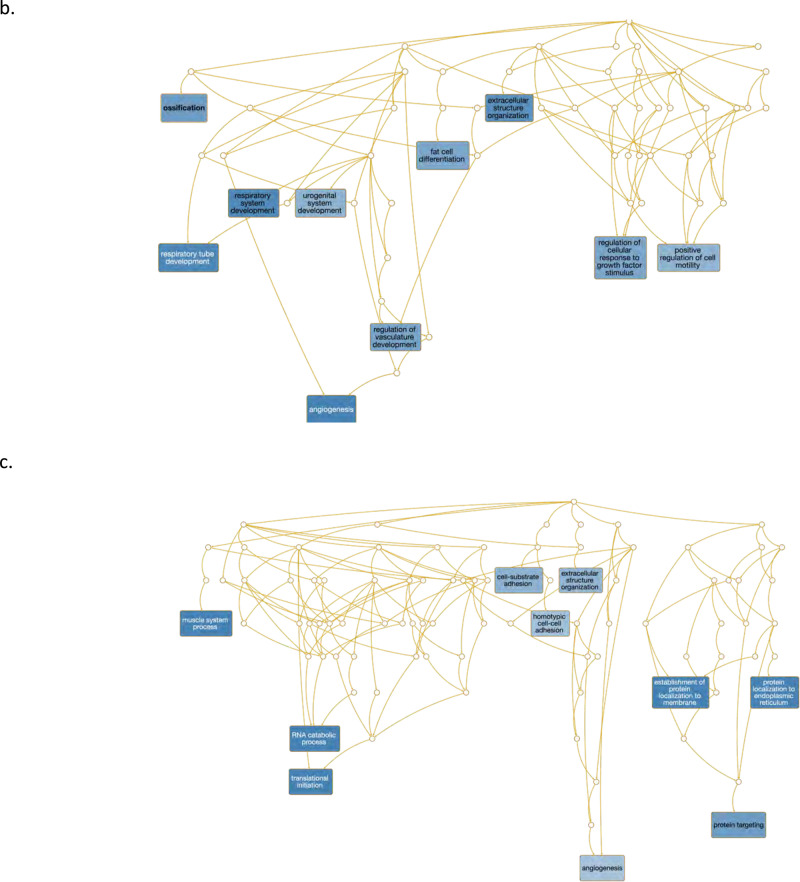
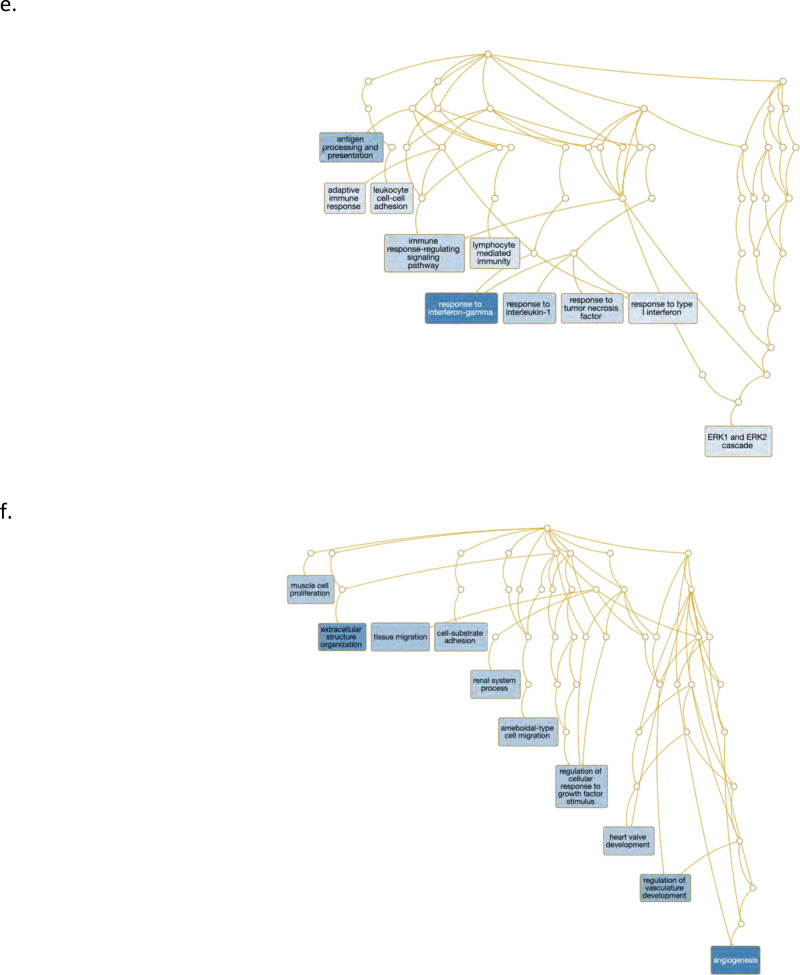
Fig. 4. Evaluation of VSMC and EC subpopulations.


a, d Biclustered heatmap visualization of all significant genes (q < 0.05) from VSMC (a) and EC (d) modules enriched with differentially expressed genes. a 1224 VSMCs from each anatomic location (2448 cells total). Large color bar denotes PA (cyan) and AC (orange) VSMCs. Small color bar above denotes distinct cell subpopulations (blue, forest green, lime green, brown, purple, magenta, red). d 448 ECs from each anatomic location (896 cells total) in. Large color bar denotes PA (blue) and AC (red) ECs. Small color bar above denotes distinct cell subpopulations (cyan, green, magenta). A dotplot corresponding to gene expression levels for each cell subpopulation on the heatmap is included. Colored dots next to specific genes correspond to critical genes related to the designated cell subpopulation. Continuous gene expression based gene ontology enrichment analysis of biological function performed based on the fraction of AC cells per subpopulation of VSMCs (b, c) and ECs (e, f). n = 3 for PA and AC groups.


