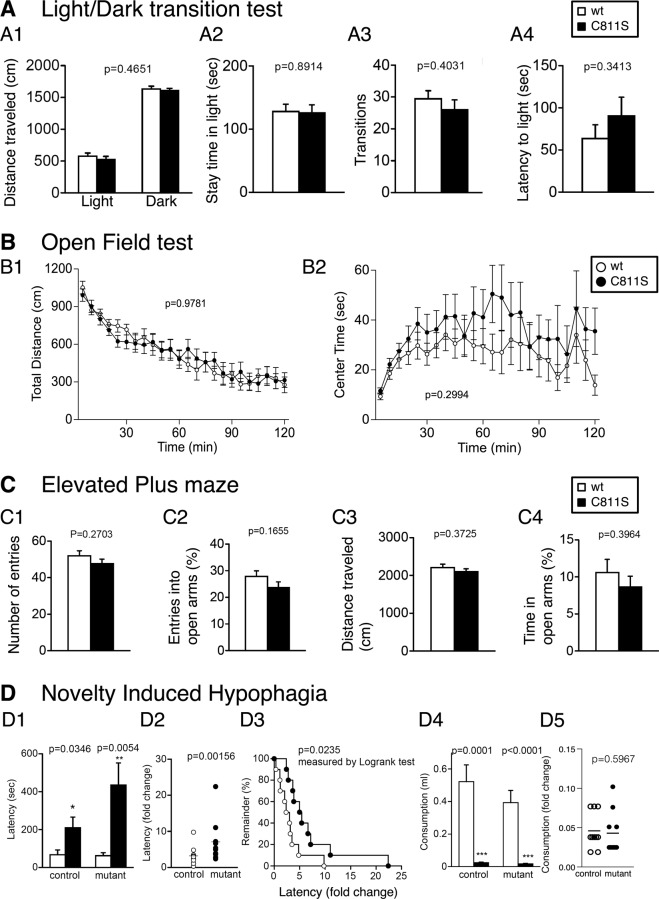
Fig. 1. Normal anxiety-like behaviors in GluA1C811S mutant mice.
A Light/dark transition test: distance traveled in the light and dark box (A1), time spent in the light chamber (s) (A2), number of transitions between the light and dark box (A3), and latency time before the first entry into the light box (s) (A4). B Open field test: total locomotion distance traveled (cm) (B1) and time spent in the center (s) (B2). C Elevated plus maze: number of entries into the center crossing between the open and closed arms (C1), percentage of entries into the open arms (C2), total distance traveled (cm) (C3), and percentage of time spent on the open arms (C4). D Novelty-induced hypophagia test: latency to begin drinking in the home (white) and novel (black) cage (D1), difference in latency between novel and home cage environments (D2, D3), consumption in the home (white) and novel (black) cage (D4), and difference in consumption between novel and home cage environments (D5). All data are expressed as mean ± SEM. The p values indicate genotype effects.

