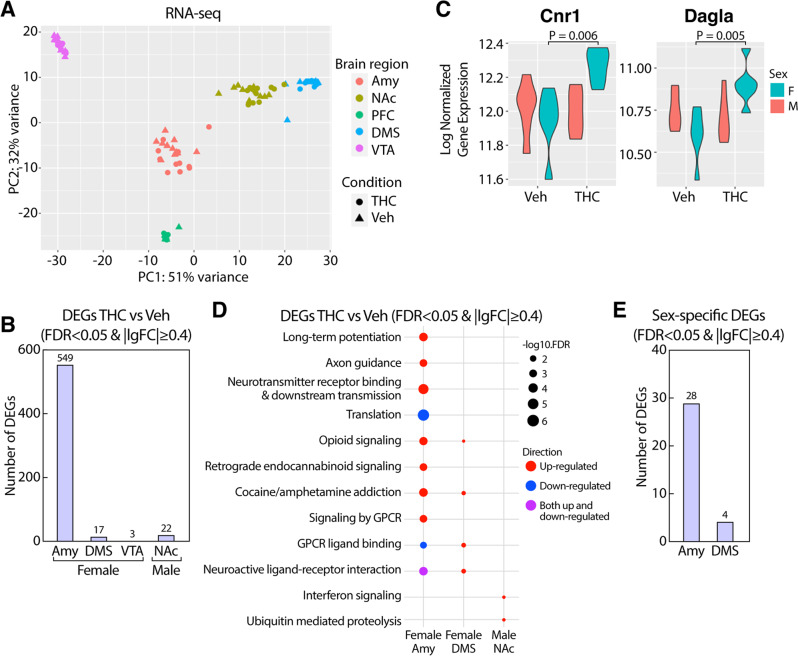
Fig. 2. Adolescent THC exposure induced sex-specific transcriptional changes.
A PCA visualization of male and female RNAseq samples across brain regions and treatment conditions. B Number of DEGs across brain regions and sexes within each sex and brain region. C Violin plots of Cnr1 and Dagla expression changes across sexes and brain regions. D Pathway enrichment for DEGs in female Amy, DMS, and male NAc. Dot color depicts the direction of regulation and dot size illustrates the significance. E Number of DEGs for treatment by sex interaction across brain regions in analyses including both sexes for each brain region.

