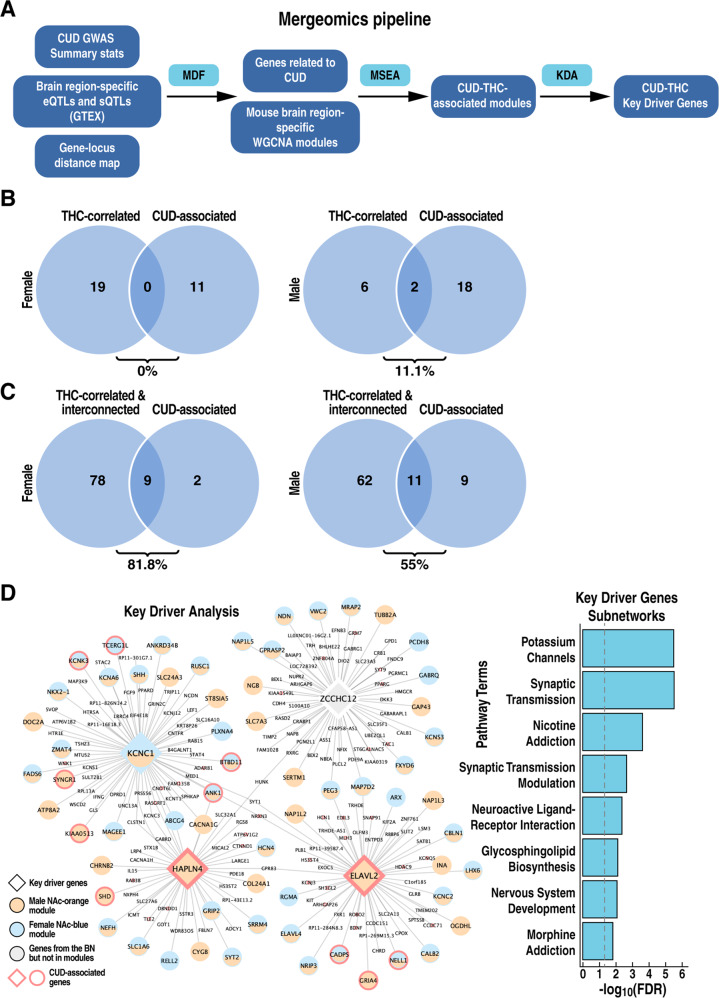
Fig. 5. Association of THC-related modules with human CUD.
A Schematic of Mergeomics pipeline. MDF marker dependency filtering, MSEA marker set enrichment analysis, KDA key driver analysis. B Overlap (%) between CUD-associated modules and THC-correlated modules (C) or between CUD-associated modules and both THC-correlated and interconnected modules (D). The overlap (%) is calculated as the number of overlapping modules divided by the total number of CUD-associated modules. D Visualization of Bayesian network shared by CUD-associated modules in female and male NAc. Key driver genes are represented by large size diamond nodes. Orange, blue, and grey nodes denote genes (male NAc orange module, genes in female NAc blue module, and genes in the BN but not in the two aforementioned modules, respectively. CUD-associated genes identified by Mergeomics using loci with p < 0.001 from the Johnson et al. [11] CUD GWAS are labeled with red borderline. The bar plot depicts pathway enrichment of the genes in the CUD subnetwork. BN, Bayesian network.

