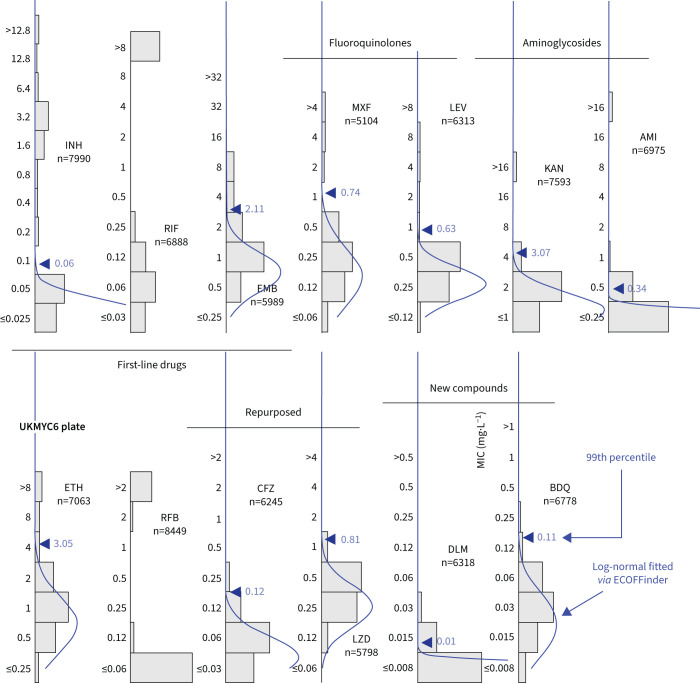
FIGURE 2.
Minimum inhibitory concentration (MIC) histograms for the 13 antibiotics on the UKMYC6 plate. Only MICs which have passed the quality assurance process described in the Methods are shown. ECOFFinder was used to fit a log-normal distribution to each histogram; this is drawn in blue and the resulting 99th percentile is labelled. ECOFFinder was unable to fit a log-normal to both RIF and RFB. See figure 1 for drug abbreviations. See supplementary figure S6 for the UKMYC5 histograms and the TSV file in the supplementary material for the numerical data. The histograms can be reproduced online [21].

