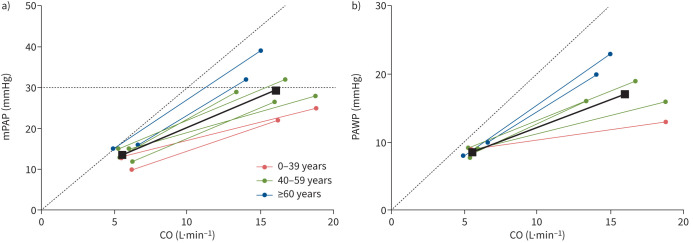
FIGURE 1.
a) Mean pulmonary arterial pressure (mPAP)/cardiac output (CO) slope (Wood units (WU) and b) pulmonary arterial wedge pressure (PAWP)/CO slope (WU) by age group in the supine position. Each line represents an individual study group or a subgroup according to stratification to age in one study (see figure 2 for details). Older subjects (blue line) had a steeper mPAP/CO and PAWP/CO slope and tended to have higher mPAP at rest. During exercise, older subjects reach higher mPAP and PAWP at lower CO values as than younger individuals. The solid black lines show the age-adjusted mean slopes (estimated by mean age across the included studies). Exercise values in healthy subjects did not exceed mPAP >30 mmHg in combination with exercise total pulmonary resistance >3 WU (dashed line in figure 1a).

