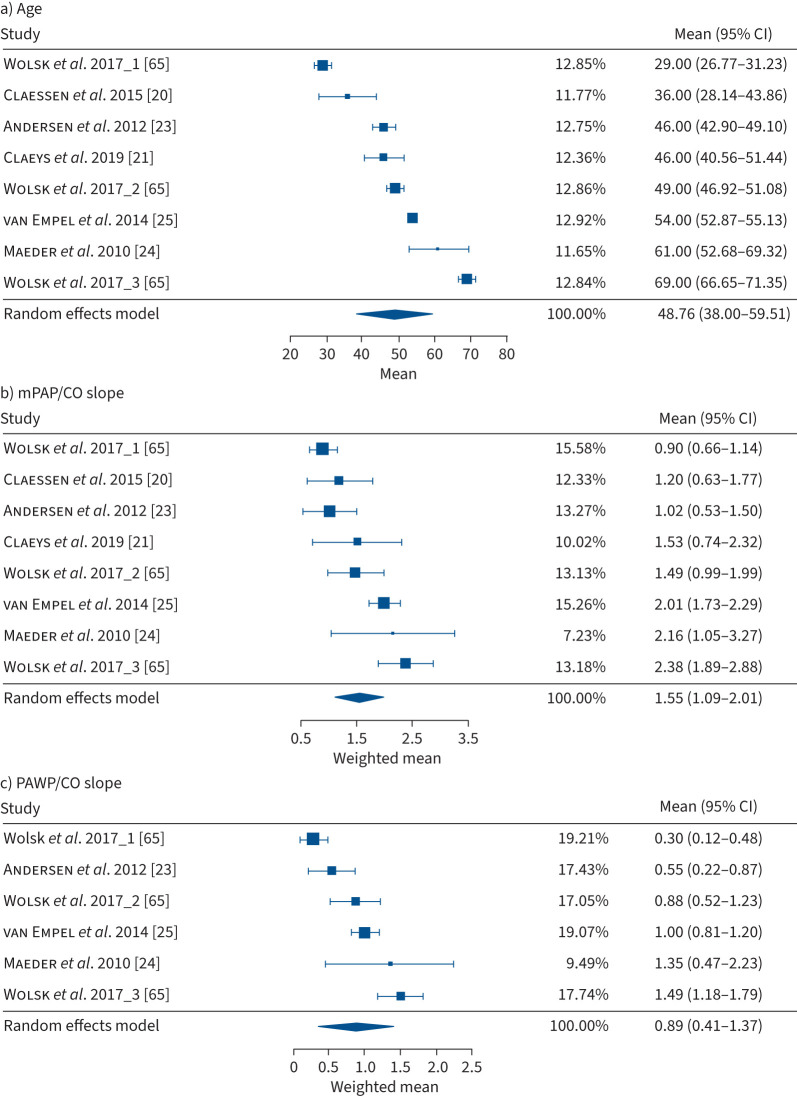
FIGURE 2.
Forrest plots of the identified studies in healthy subjects in the supine position for a) mean age (years), b) mean pulmonary arterial pressure (mPAP)/cardiac output (CO) slope (Wood units (WU)) and c) pulmonary arterial wedge pressure (PAWP)/CO slope (WU). Estimates were computed using the Knapp–Hartung correction due to the low number of available studies. The study of Wolsk et al. [65] assessed different age groups that are separately displayed in the Forrest plot, showing the influence of age on cardiopulmonary haemodynamic parameters during exercise. Wolsk et al. 2017_1 provided the youngest age group (<40 years) and Wolsk et al. 2017_3 the oldest ( >60 years) [65].

