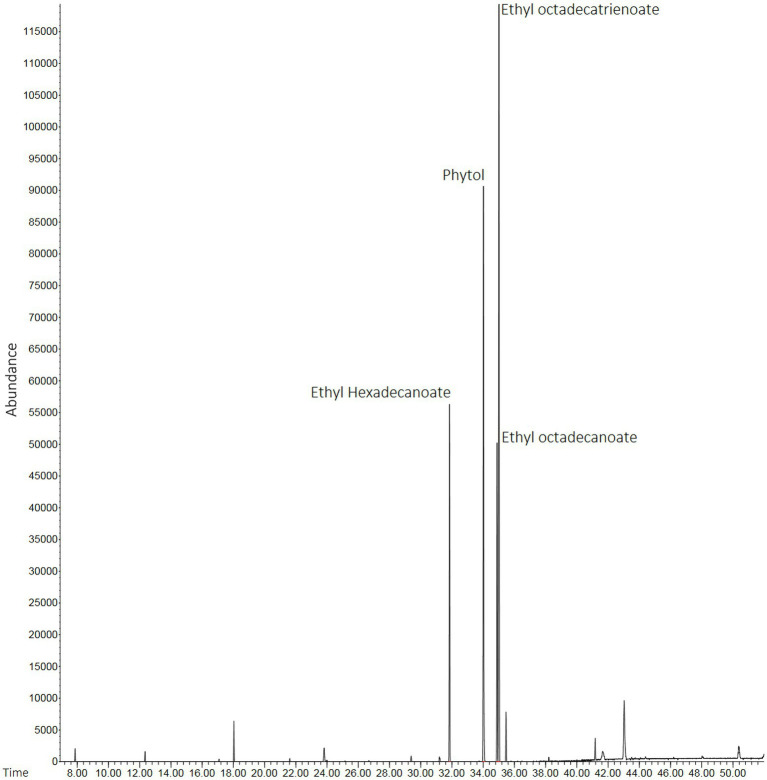
Figure 1.
Chromatographic profiles of HEScL using gas chromatography with mass spectrometry (GC–MS) and spectral mass database (NIST 11). Time: x-axis of the gas chromatogram corresponds to retention time RT (a measure of the time taken for a solute to pass through a chromatography column) in minutes. Abundance: y-axis of the gas chromatogram (area of the peak) is a reflection of the amount of a specific analyte (relative distribution of compounds in the sample).

