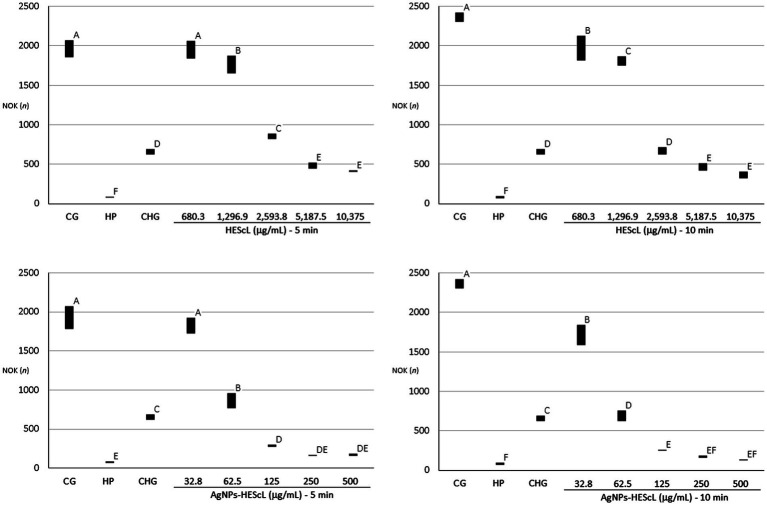
Figure 5.
Quantitative profiles of NOK-SI obtained from those treated with different concentrations of HEScL and AgNPs-HEScL for 5 and 10 min. Means with the same letters (A, B, C, D, E, or F) are not significantly different (p < 0.05). CG, cell growth (positive control); HP, hydrogen peroxide (negative control); CHG, chlorhexidine digluconate (negative control).

