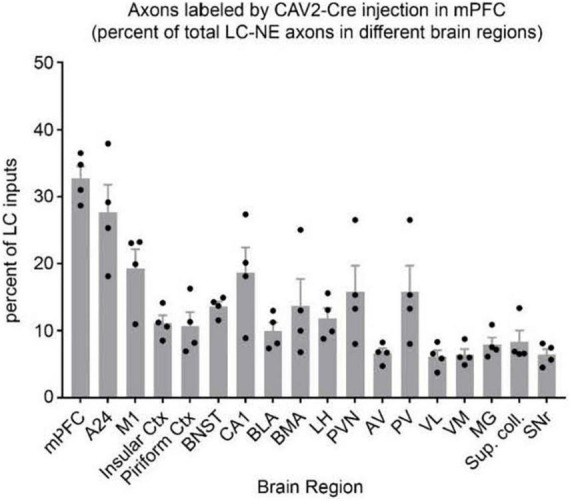
FIGURE 4.

Distribution of axon collaterals from LC neurons projecting to mPFC. The bar graph (n = 4 mice) indicates percentage of LC-NE axons at each brain region that originate from EGFP + mPFC-projecting LC-NE neurons. LC-NE neurons are represented as percent of total LC-NE inputs (sum of EGFP + and tdTomato +) in select brain regions. mPFC, medial prefrontal cortex; A24, ventral anterior cingulate; insular ctx, insular cortex; M1, primary motor cortex; piriform ctx, piriform cortex; BNST, bed nucleus of the stria terminalis; CA1, area CA1 of the hippocampus; BLA, basolateral amygdala; BMA, basomedial amygdala; LH, lateral hypothalamus; PVN, paraventricular hypothalamic nuc; AV, anteroventral thalamic nuc; PV, paraventricular thalamic nuc; VL, ventrolateral thalamic nuc; VM, ventromedial thalamic nuc; MG, medial geniculate nuc; Sup. coll., superior colliculus; SNr, substantia nigra. Adapted from Plummer et al. (2020).
