Figure 1.

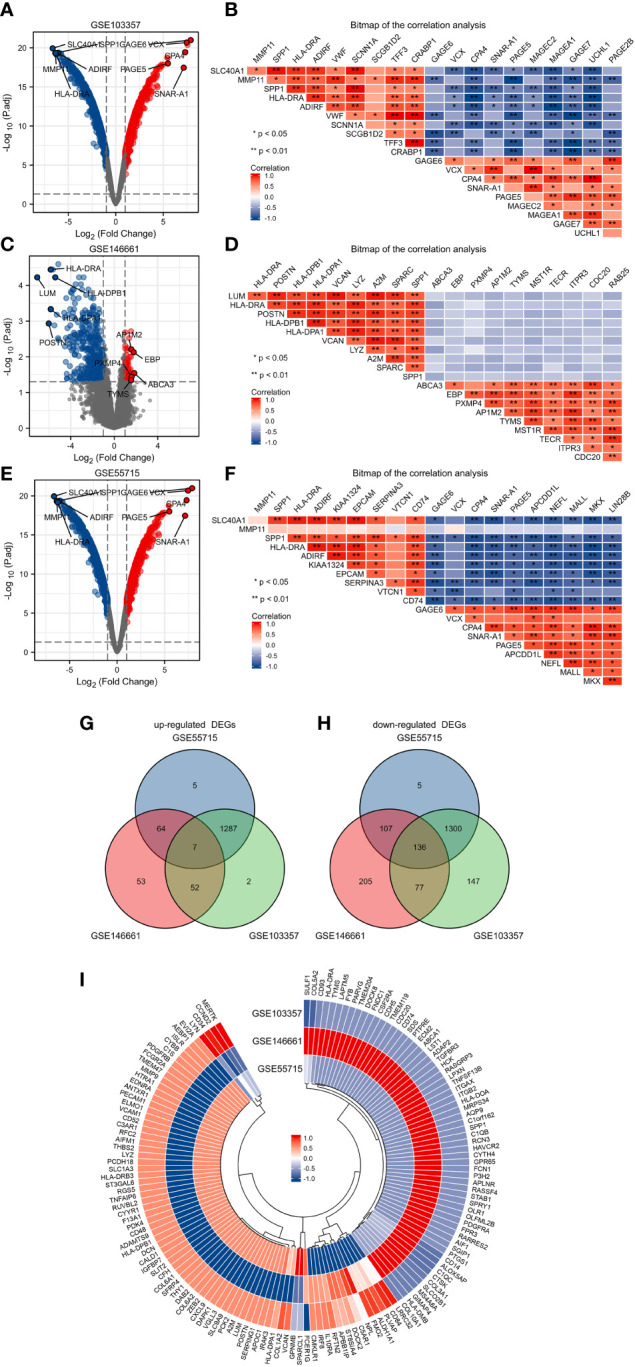
Identification of DEGs in GSE103357, GSE146661 and GSE55715. (A) The volcano plots showing all the expressed genes from GSE103357. (B) The heatmap of the correlation analysis between the top 10 up or downregulated DEGs in GSE103357. (C) The volcano plots showing all the expressed genes from GSE146661. (D) The heatmap of the correlation analysis between the top 10 up or downregulated DEGs in GSE146661. (E) The volcano plots showing all the expressed genes from GSE55715. (F) The heatmap of the correlation analysis between the top 10 up or downregulated DEGs in GSE55715. (G, H) The Venn diagram of up-regulated and down-regulated DEGs. (I) The annular heatmap of 143 overlapping DEGs. Blue represents downregulated genes, and red represents upregulated genes in the volcano plots. Red and blue denoted positive and negative correlation in the Correlation heatmap. Each column represents one dataset, and each row represents one gene in the annular heatmap. Blue represents downregulated genes and red represents upregulated genes in the annular heatmap. DEGs: differentially expressed gene.
