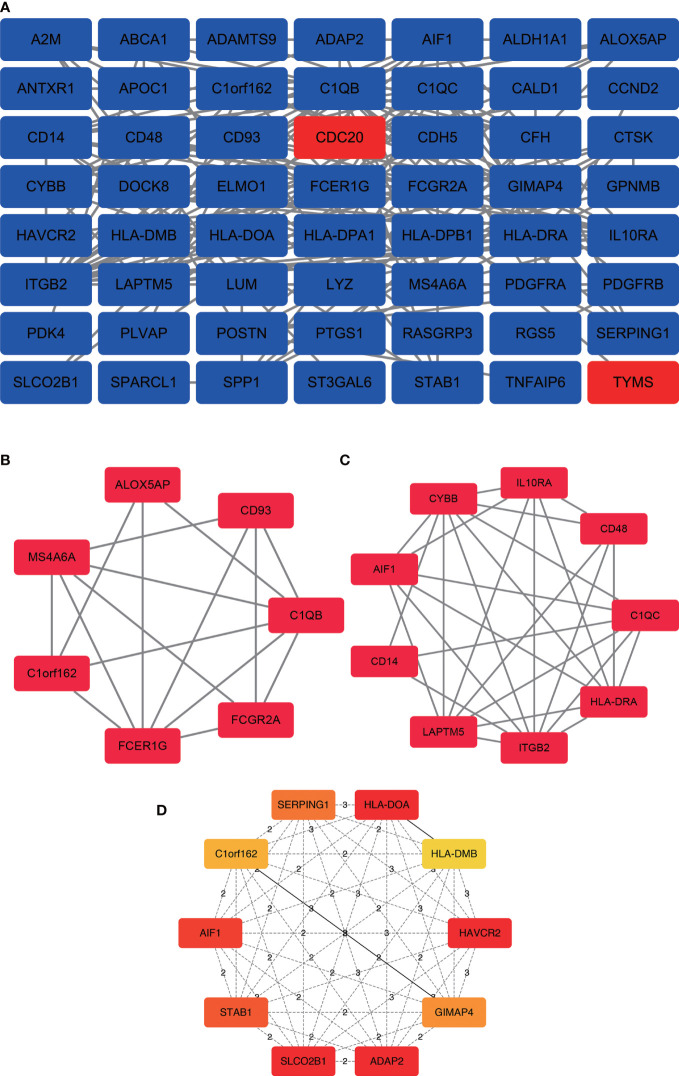
Figure 3.
PPI network construction and analysis of hub genes. (A) The most significant module was obtained from the PPI network with 56 nodes and 178 edges. (B) Module 1 contained 7 upregulated genes nodes and 16 edges, MCODE score=5.33. (C) Module 2 contained 9 gene nodes and 28 edges, MCODE score=7. (D) The hub genes were selected from the PPI network using the cytoHubba plugin. DEGs, differentially expressed genes; PPI, protein–protein interaction.

