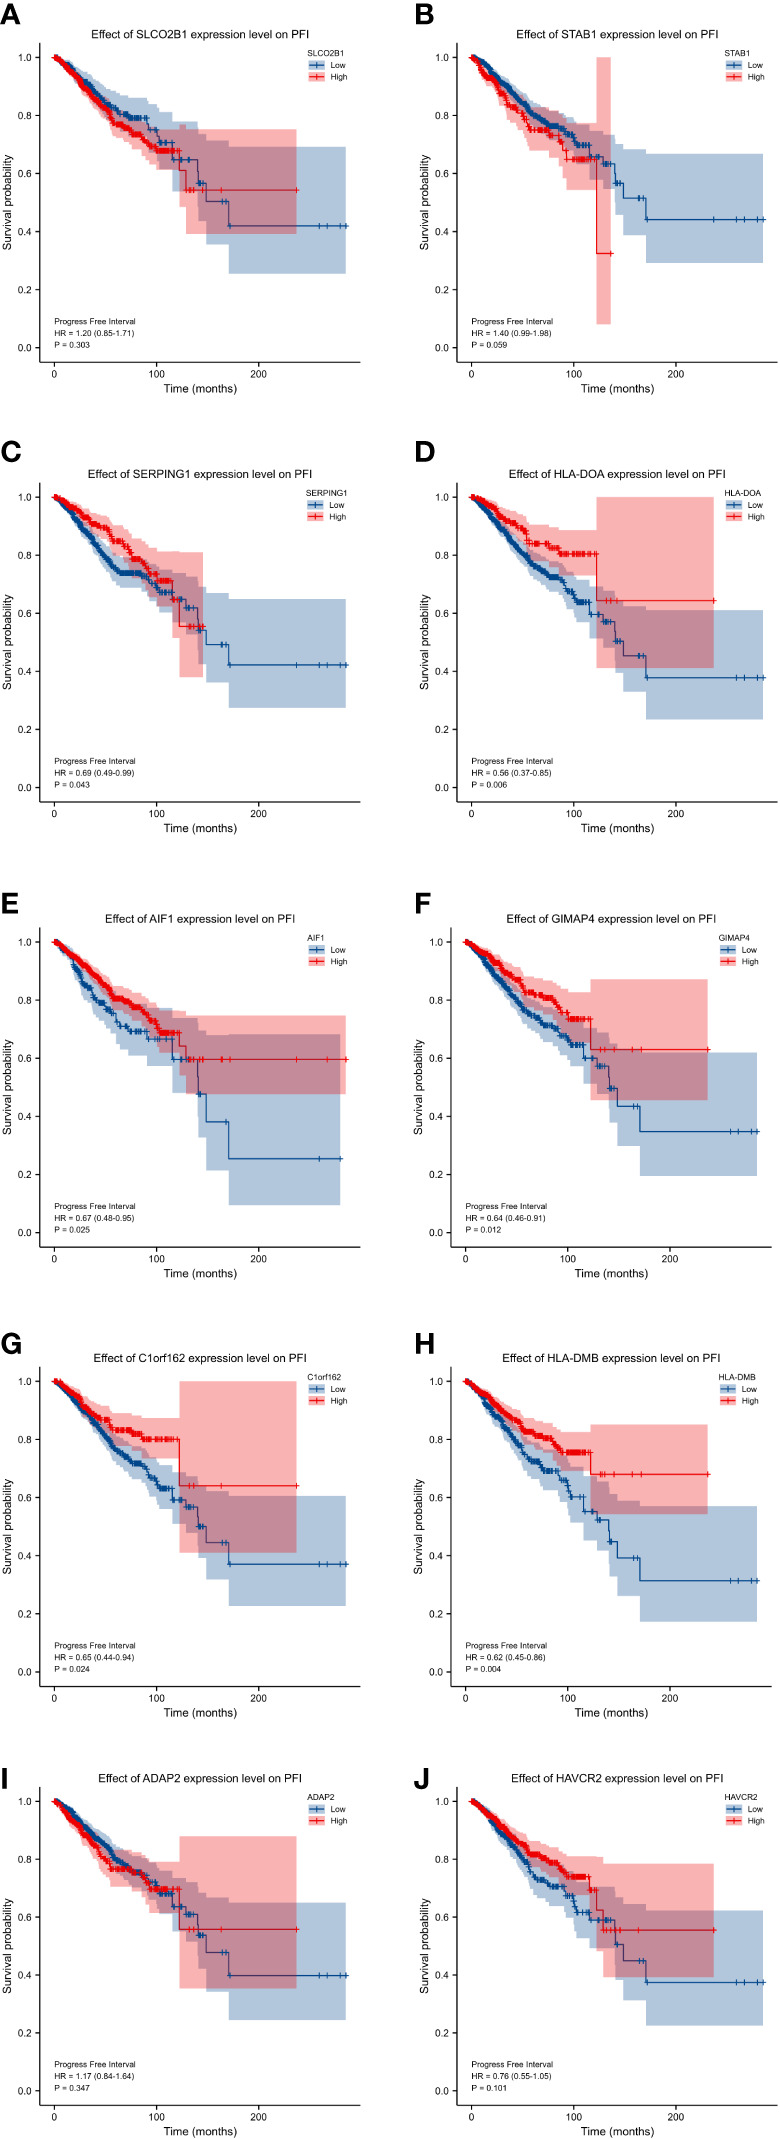
Figure 5.

progression-free interval (PFI) curves of the 10 hub genes. progression-free interval (PFI) curves by high and low expression of various genes in BC patients. (A) SLCO2B1 (B) STAB1 (C) SERPING1 (D) HLA-DOA (E) AIF1 (F) GIMAP4 (G) C1orf162 (H) HLA-DMB. (I) ADAP2 (J) HAVCR2.
