FIGURE 8.

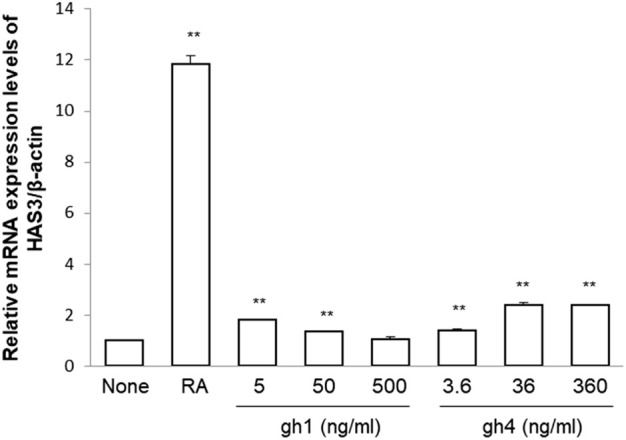
mRNA expression of HAS3 in keratinocytes treated with gh1 and gh4. Retinoic acid (1 μM) was used as positive control. ** p < 0.01 compared to blank group.

mRNA expression of HAS3 in keratinocytes treated with gh1 and gh4. Retinoic acid (1 μM) was used as positive control. ** p < 0.01 compared to blank group.