
Figure 1. Detection and validation of the PDA microbiome.
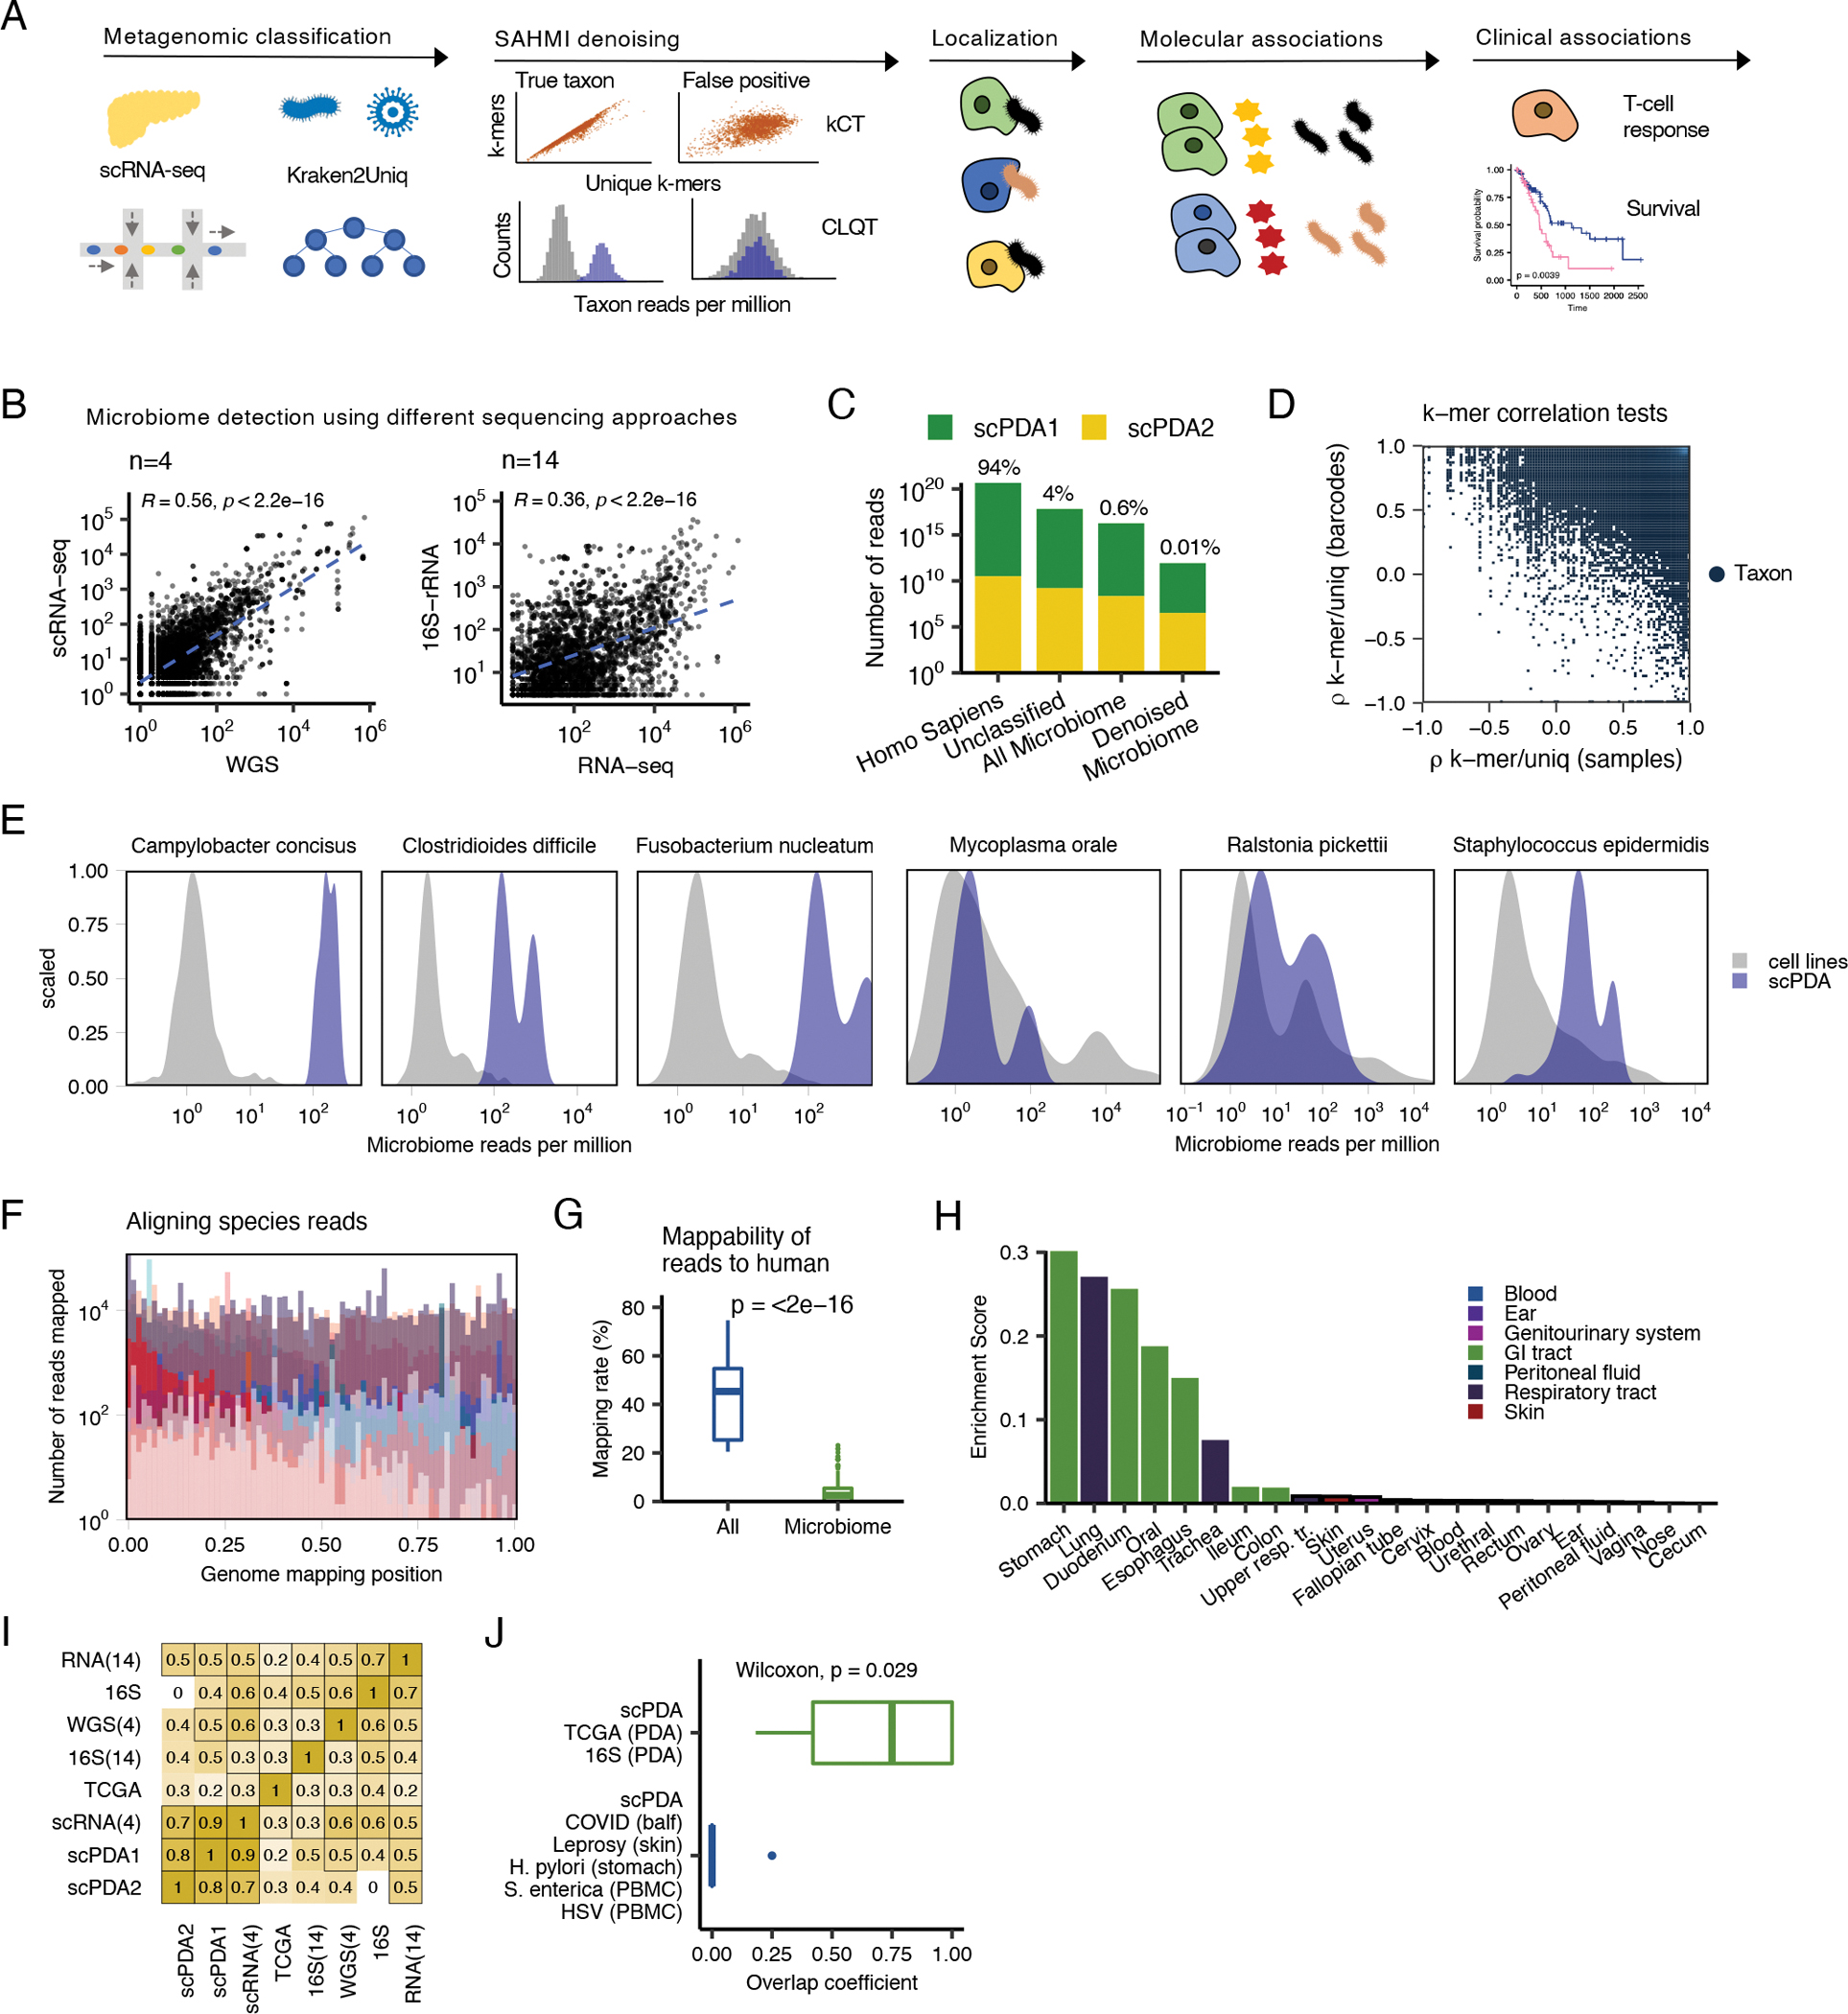
(A) Study design. See also Table S1. scRNA-seq, single-cell RNA sequencing; kCT, k-mer correlation tests; CLQT, cell line quantile test (B) Scatter plots showing microbial genus and species counts correlations from pancreatic tumor sequenced with different technologies. Blue dashed line, line of best fit; Spearman correlation test; WGS, whole genome sequencing. (C) Stacked bar plot showing the classification of reads from scPDA1-2 by SAHMI. (D). Scatter plot of the k-mer correlation tests for all detected species in scPDA1-2. Each point represents a species. x-axis, species Spearman correlation value between the number of total vs. unique k-mers assigned to a given species across samples; y-axis, Spearman correlation value between the number of total vs. unique k-mers assigned to a given species across barcodes. True species have significant correlations in both measures. (E) Example normalized counts density plots comparing reads per million for select species in detected in scPDA1-2 to the same species detected in thousands of cell-line experiments that serve as a negative control. The left three plots are species detected above the contamination and noise threshold. The right three plots are contaminants. (F) Overlaid histograms of genome mapping positions of reads resolved to the species level in scPDA1-2 showing that reads map to locations throughout their respective genome. Each color represents an individual species. Mapping positions are scaled per species. See also Fig. S1B. (G) Boxplots comparing the percent of reads mappable to the human genome for all reads vs. microbiome reads. Boxplots show median (line), 25th and 75th percentiles (box) and 1.5xIQR (whiskers). Points represent outliers; Wilcoxon testing. (H) Bar plot indicating the body location enrichment score for the genera identified in scPDA1-2. (I) Heatmap of Spearman correlations of bacterial genus counts from pancreatic tumor from multiple studies and sequencing technologies. RNA-seq(14) and 16S-rDNA-seq(14), 14 in-house samples sequenced with total RNA-seq and 16S-rDNA-seq; WGS(4) and scRNA-seq(4), 4 in-house samples profiled with single-cell RNA and whole genome sequencing. 16S, pancreas tumors from (Nejman et al., 2020).; TCGA, pancreas tumor from (Poore et al., 2020). (J) Boxplot showing overlap coefficients comparing genera from scPDA1-2 to genera from other PDA studies (green) or from other tissue types and diseases (blue). Boxplots are as in (G); Wilcoxon testing. See also Figure S1 and Table S1.