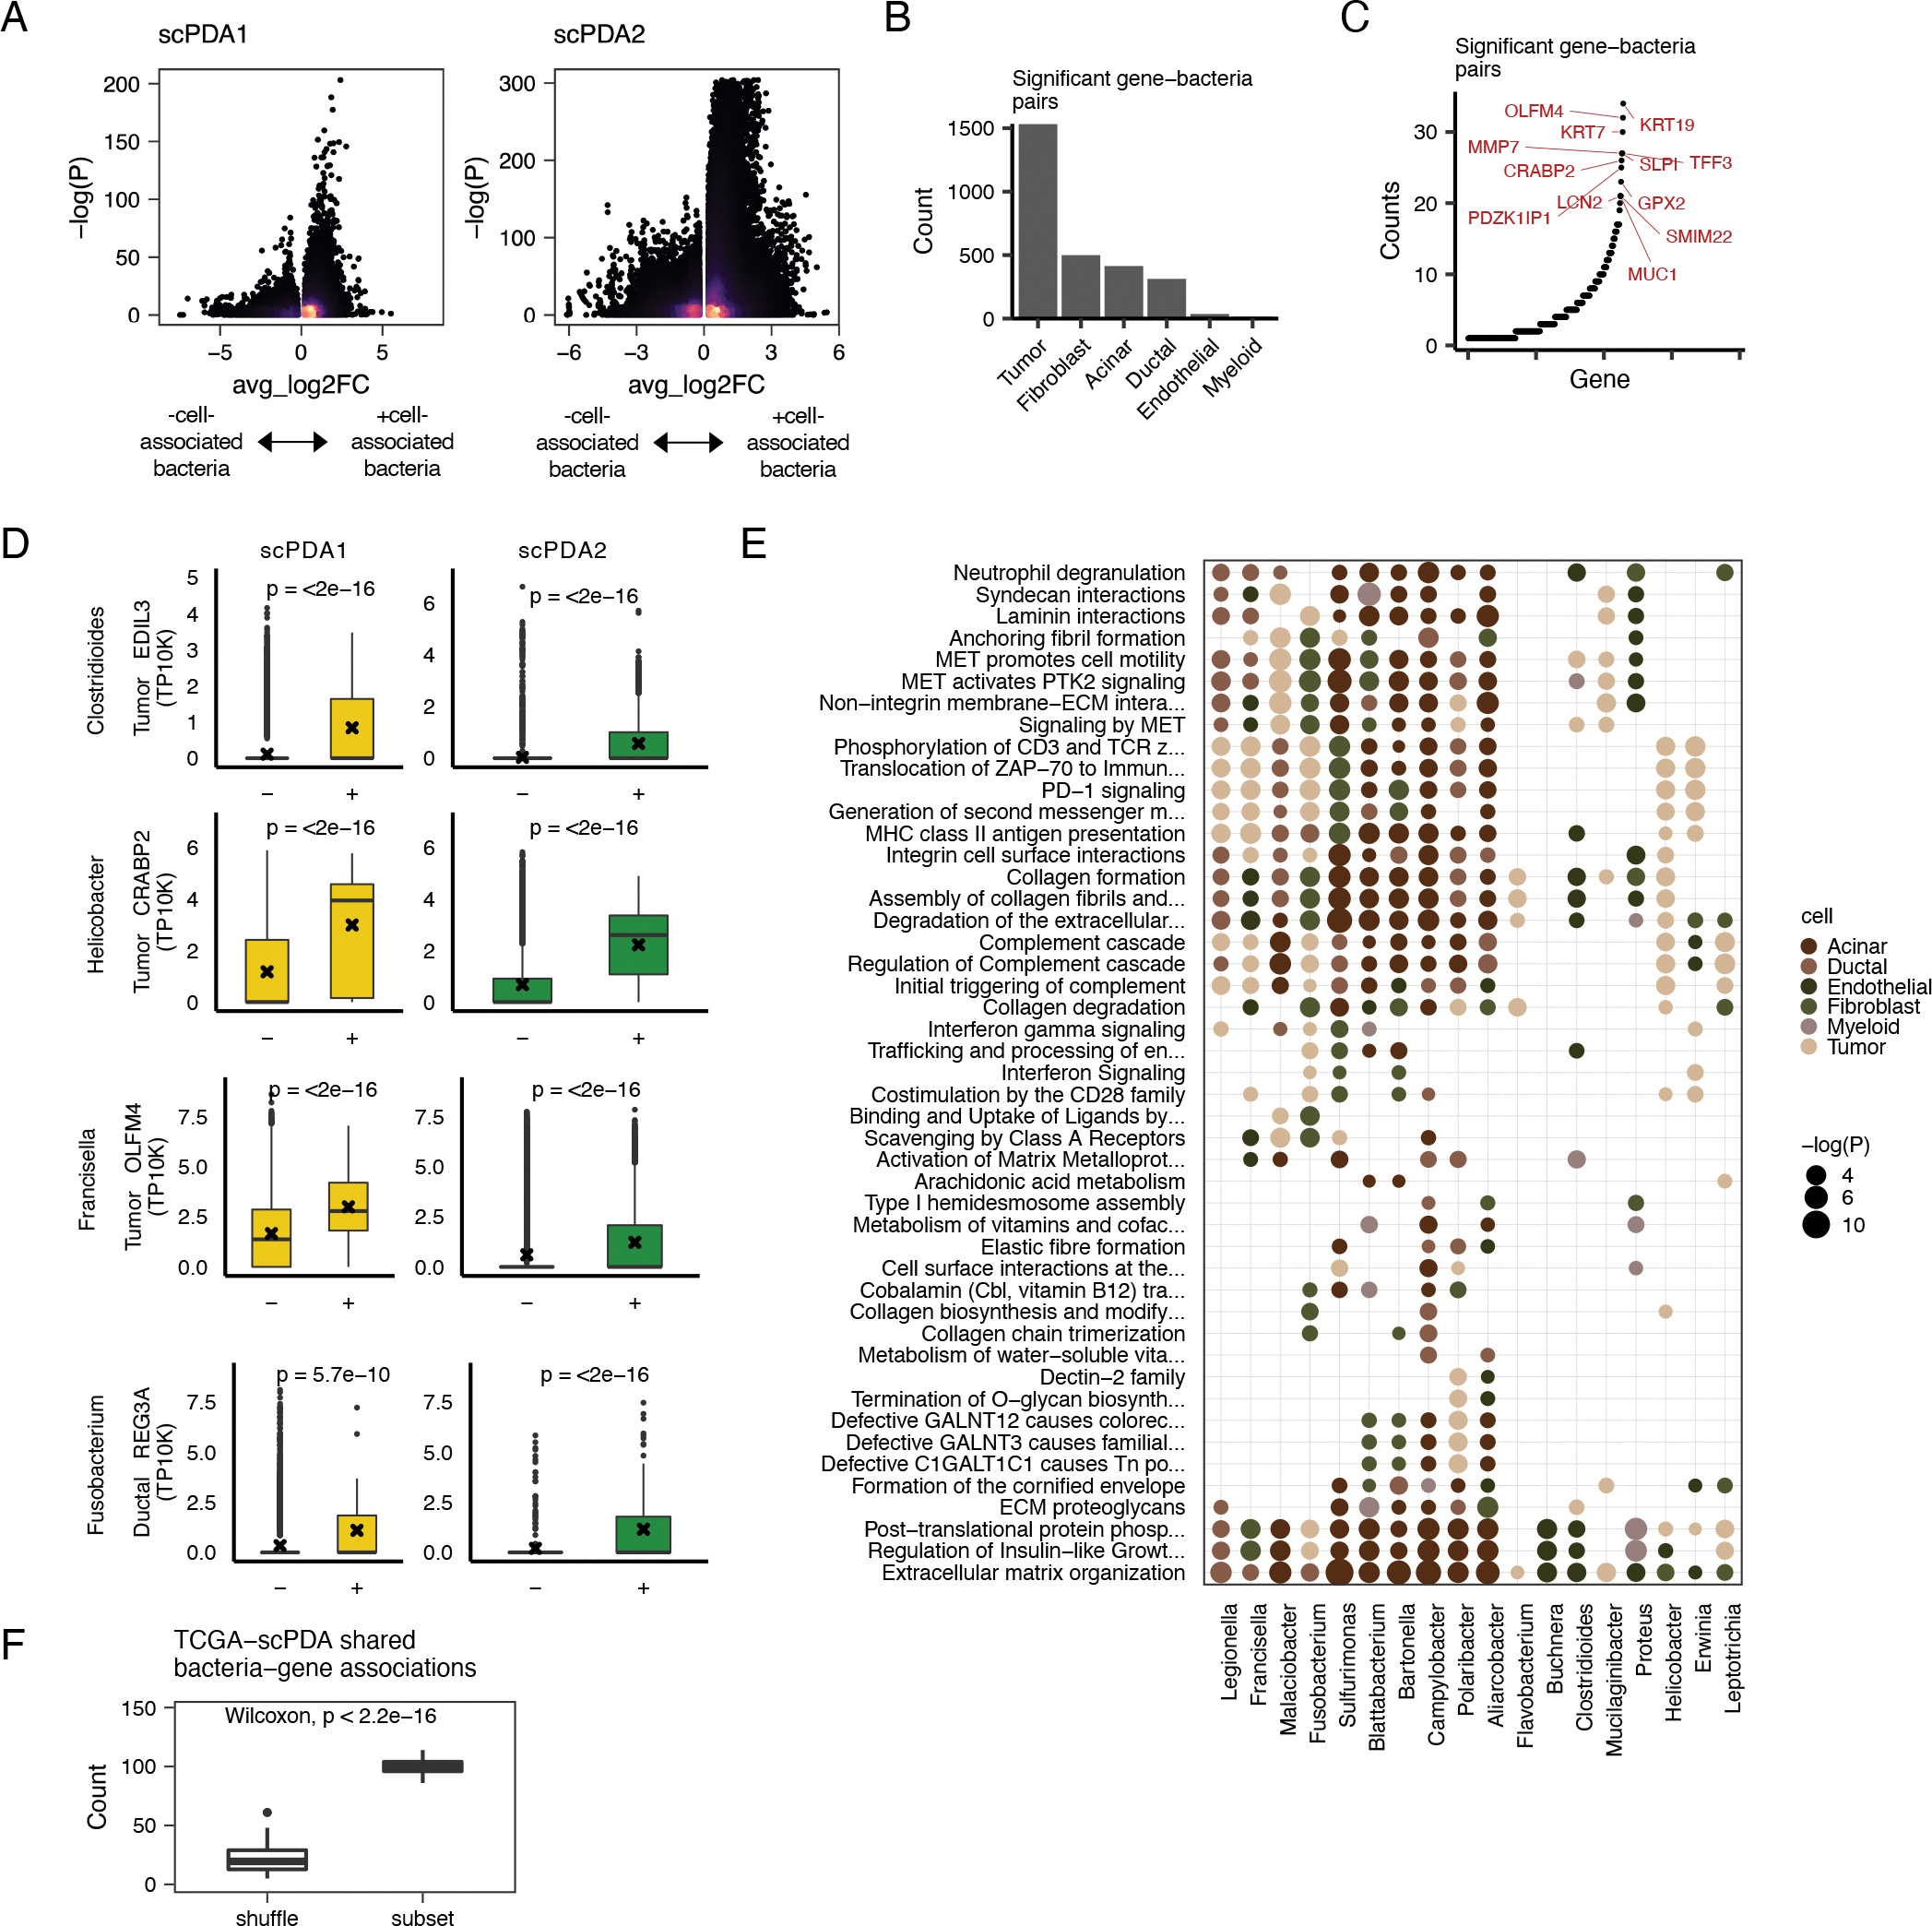
Figure 3. Bacteria associate with cell-type specific activities.

(A) Volcano plots for bacteria-cell-type specific gene associations. Wilcoxon tests are run comparing gene expression values between somatic cells with or without co-localized bacteria. X-axis, average log2 fold change in normalized expression in cells with vs. without co-localized bacteria. Y-axis, Wilcoxon test FDR-corrected p-value. Color is scaled to point density, black=low, yellow=high. (B) Bar plot showing the number of significant gene-bacteria pairs per cell type for significant pairs shared by scPDA1-2. Significant genes are were identified as having an FDR-corrected p-value<0.05 in the analysis from Fig. 3A and the a fold change in the same direction in scPDA1 and 2. (C) Ranked scatter plot showing the number of times each significant gene was differentially expressed, either with different bacteria or in different cell types. Significant genes were identified as in the same manner as in Fig. 3A–B. (D) Boxplots comparing gene expression values in cells with (+) or without (−) a specific co-localized bacterial genus. Boxplots show median (line), 25th and 75th percentiles (box) and 1.5xIQR (whiskers); points represent outliers; ‘x’ denotes the mean value. (E) Dot plot showing the Reactome pathways enriched by the differentially expressed genes shared by scPDA1-2. Dots are colored by cell-type and size-scaled by p-value. Data is shown for pathways with FDR-corrected p<0.05 (hypergeometric test). (F) Boxplot comparing the number of shared bacteria-gene associations between scPDA1-2 and TCGA data. Associations are calculated from subsampled and sample-label shuffled data. Wilcoxon testing. See also Table S2 and Table S3.
