
Figure 4. T-cell subtypes in tumors with cell-associated bacteria.
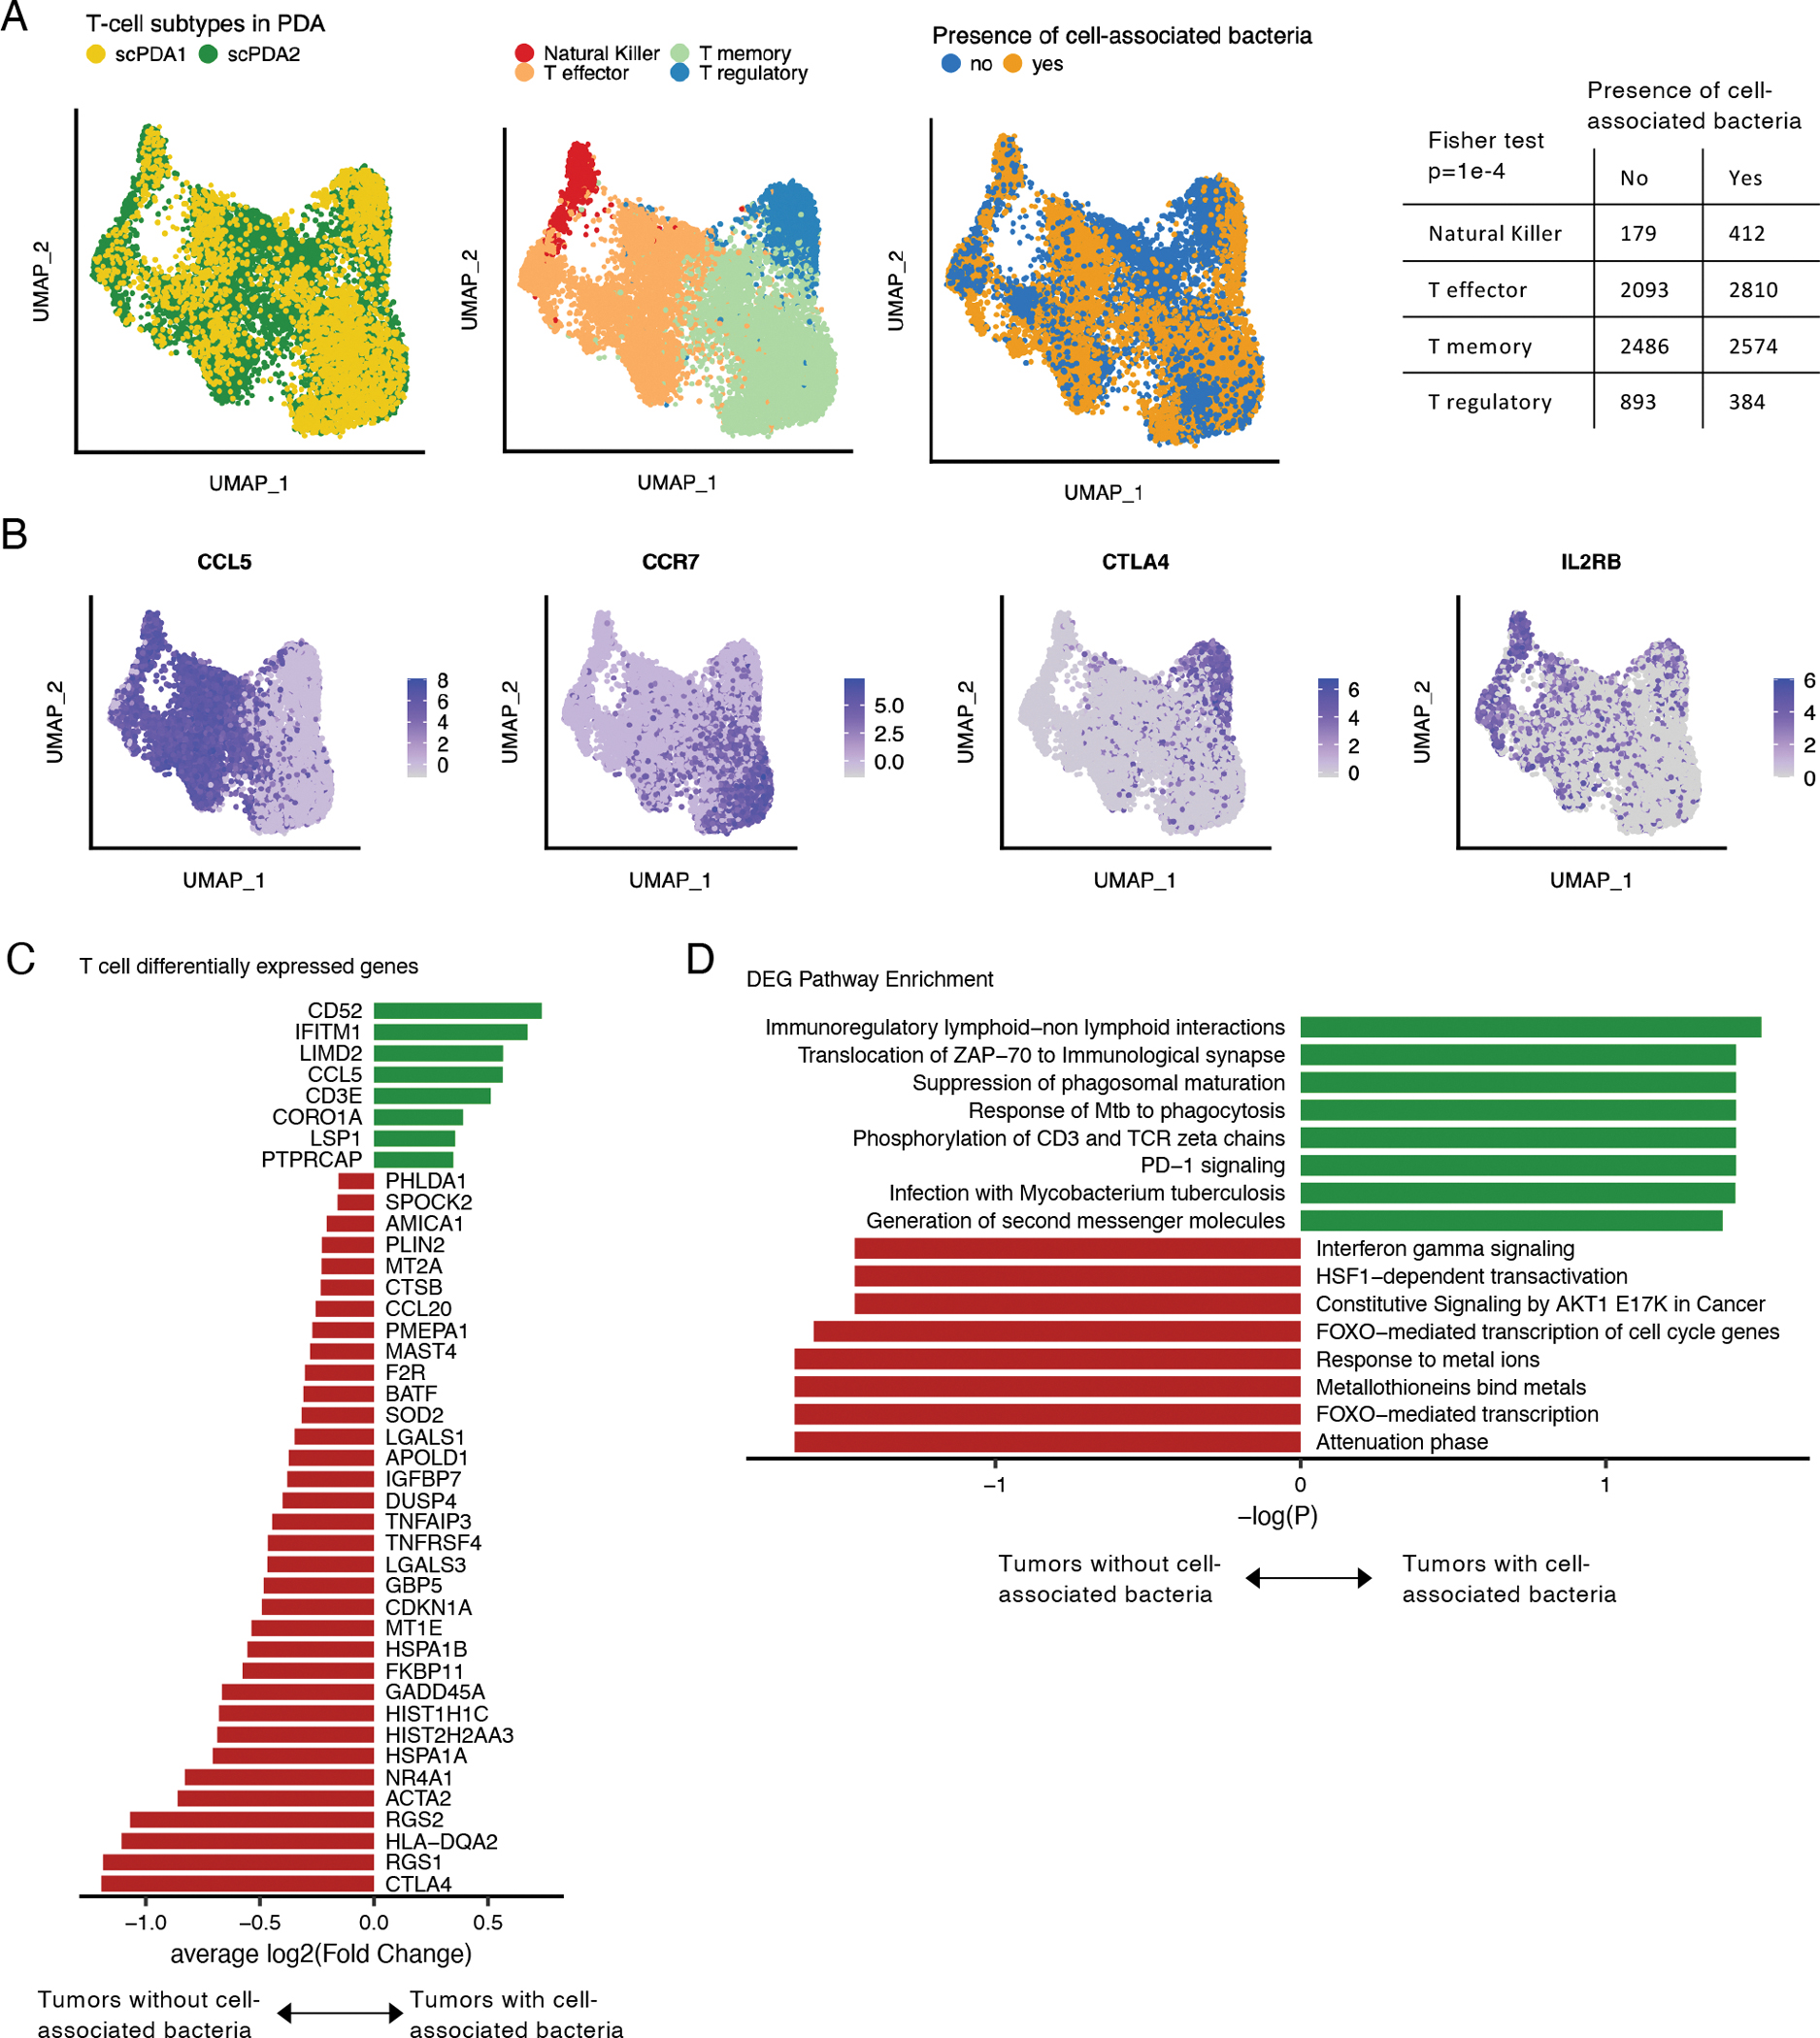
(A) Uniform manifold and projection (UMAP) plots of T-cells from scPDA1 and 2 after batch correction. Left: colored by study; middle: colored by major T-cell subtype; right: colored by the presence of absence of cell-associated bacteria in the same tumor sample. Table: counts of T-cell subtype in tumors with or without cell-associated bacteria. (B) Uniform manifold approximation and project (UMAP) plots of batch-corrected T-cell data from scPDA1 and 2 colored by normalized expression of selected T-cell subtype markers. (C) Significantly differentially expressed genes shared in scPDA1-2 (Wilcoxon tests) in T-cells from tumors with or without cell-associated bacteria. Bar length represents the mean log2(Fold change). (D) Reactome pathway enrichment for the differentially expressed genes from (C). See also Figure S2.