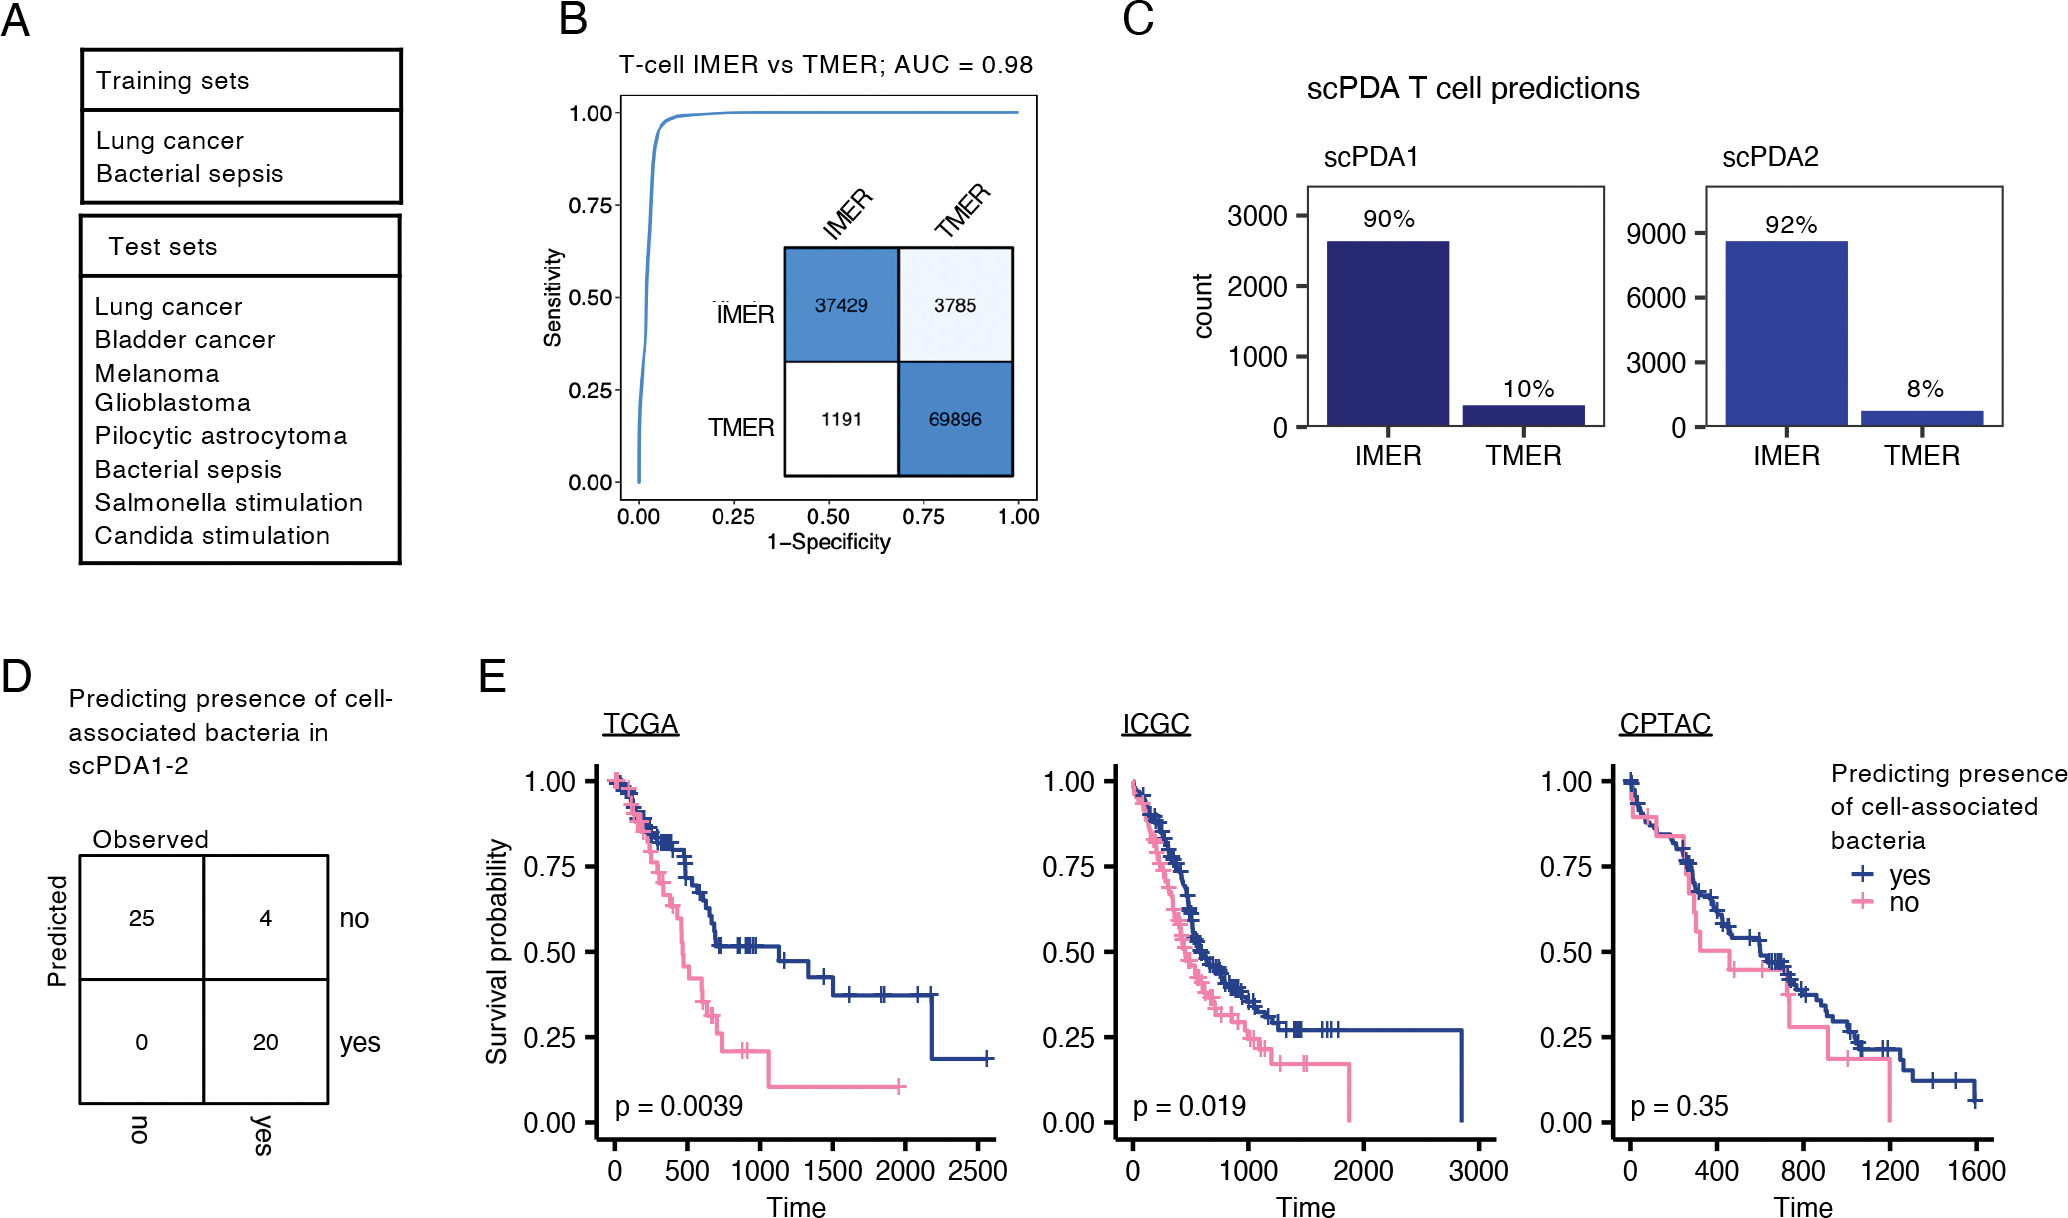
Figure 5. T-cell microenvironment reaction and survival model.

(A) Training and test datasets used to create a random forest model to distinguish between T-cells infection vs. tumor microenvironment reaction based on their gene expression profiles. (B) ROC curve indicating exceptional model performance on test datasets; AUC, area under the curve, IMER, infection-microenvironment reaction, TMER, tumor-microenvironment reaction. Inset: Confusion matrix of model assignments; rows, predicted, columns, true values. (C) Bar-plot of predicted T-cell microenvironment reaction in scPDA1 and 2. (D) Development of a classification model to predict the presence of cell-associated bacteria in a tumor using 7 bulk gene expression values. Confusion matrix showing classification accuracy of the model on scPDA1 and 2. (E) Kaplan-Meier plots of TCGA, ICGC, and CPTAC PDA cohorts stratified by predicted presence of cell-associated bacteria. P-values are determined by Cox proportional hazards models.
