FIGURE 2.

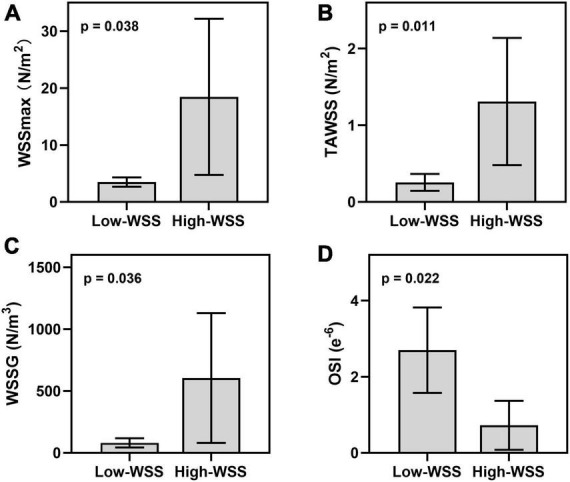
Hemodynamic difference between high-WSS and low-WSS groups in the aneurysms forming area. (A) Results of WSSmax. (B) Results of TAWSS. (C) Results of WSSG. (D) Results of OSI.

Hemodynamic difference between high-WSS and low-WSS groups in the aneurysms forming area. (A) Results of WSSmax. (B) Results of TAWSS. (C) Results of WSSG. (D) Results of OSI.