
Figure 3.
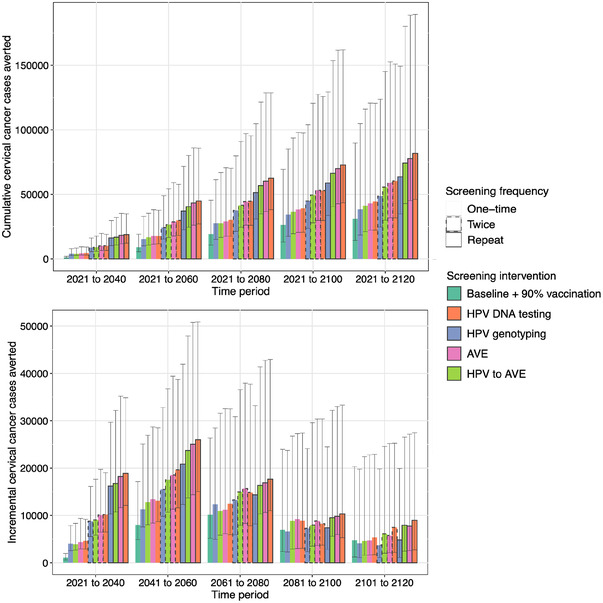
Cumulative (top) and incremental (bottom) cancer cases averted under scenarios that differ in HPV vaccination coverage and cervical cancer screening and treatment frequency, method and loss‐to‐follow‐up. Cases averted are defined with reference to the baseline strategy. The top panel shows the cumulative cases averted over time in 20‐year increments. The bottom panel shows the incremental cases averted over each 20‐year period. The columns show the median estimates from across the 25 simulations and the error bars show the range of estimates. Scenarios are ordered from lowest to highest in terms of cumulative cases averted. Note the different scales on the y‐axis for the two plots. Abbreviations: AVE, automated visual evaluation; HPV, human papillomavirus.