
Figure 4.
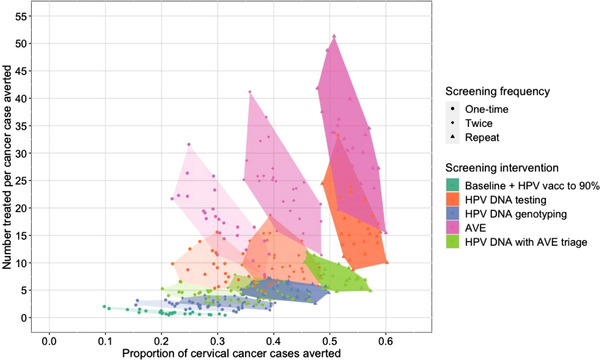
Cumulative proportion of cervical cancer cases averted (x‐axis) by the number of cases treated for precancer per cancer case averted (y‐axis) under scenarios that differ in HPV vaccination coverage and cervical cancer screening and treatment frequency, method and loss‐to‐follow‐up. Cancer cases averted are defined as the difference between the cumulative number of incident cancer cases over the simulated period with the baseline scenario and the cumulative number of cases with each comparator scenario. Here, we show the proportion of cancer cases with the baseline scenario that are averted. The y‐axis shows the ratio of the cumulative number of cases treated with ⩽CIN3 to the number of cancer cases averted. The points show the results from each of the 25 simulations with each scenario. The shaded regions denote the convex hull of the points for each scenario. Lighter shading and round points indicate scenarios with one‐time screening; medium shading and diamond points indicate scenarios with twice‐lifetime screening; darker shading and triangular points indicate scenarios with repeat screening. Abbreviations: AVE, automated visual evaluation; HPV, human papillomavirus.