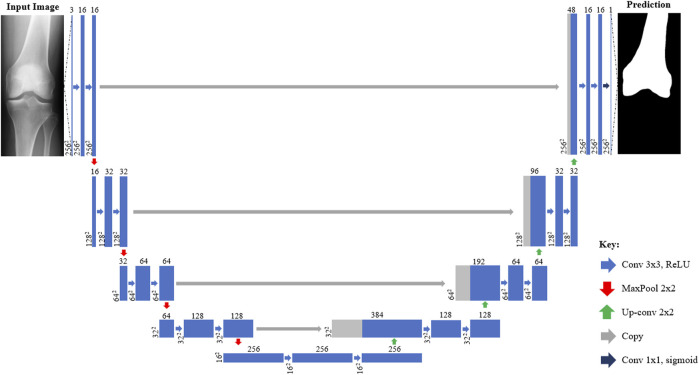
FIGURE 2.
Architecture of U-Net CNN X-ray segmentation models from inputted X-ray image (left) to predicted mask (right). Each box corresponds to a multi-channel feature map with those shaded grey indicating where channels have been copied from previous layers. The number of channels is denoted on top of each box with the size provided at the lower left (2562 = 256 × 256 pixels). Arrows denote different operations such as convolutions.

