FIGURE 4.

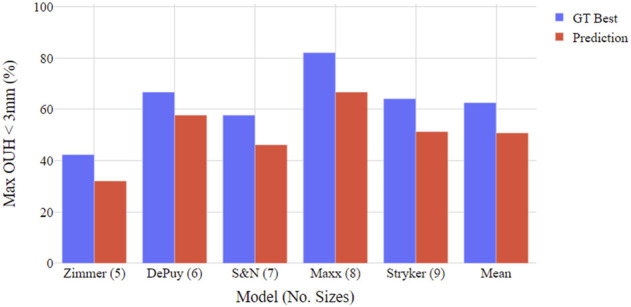
Boxplot illustrating proportion of test subjects achieving maximum OUH < 3 mm for various femur component model sizings. Both ground truth (GT) best possible size and tool prediction results shown.

Boxplot illustrating proportion of test subjects achieving maximum OUH < 3 mm for various femur component model sizings. Both ground truth (GT) best possible size and tool prediction results shown.