FIGURE 3.
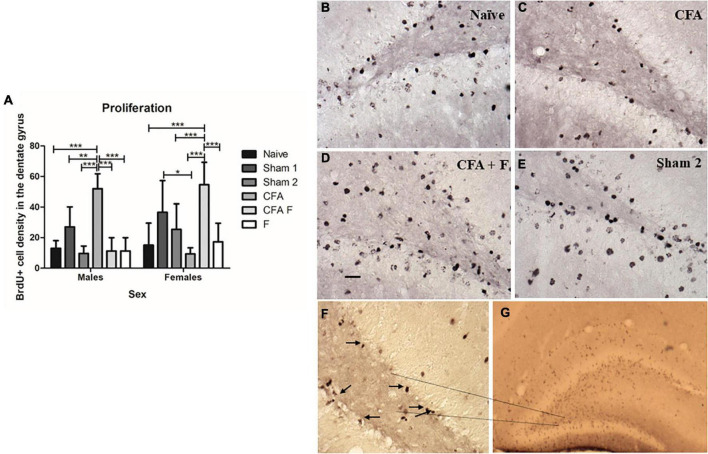
Cell proliferation in the dentate gyrus on P10. (A) There was an interaction between Group*Sex [F(5,44) = 11.963, p = 0.00]. Among females, the CFA + F group showed the highest number of BrdU-labeled cells in the dentate gyrus, whereas the CFA group showed the lowest number of BrdU-labeled cells. The CFA group demonstrated a decreased number of BrdU-labeled cells when compared to Sham 1 (p = 0.02) and CFA + F (p = 0.00) groups. The CFA + F group showed higher number of BrdU-labeled cells when compared to Naïve (p = 0.00), Sham 2 (p = 0.03), CFA (p = 0.00) and F (p = 0.00). Oppositely, among males, the CFA group demonstrated the highest number of BrdU-labeled cells in the dentate gyrus, when compared to Naïve (p = 0.00), Sham 1 (p = 0.01), Sham 2 (p = 0.00), CFA + F (p = 0.00) and F (p = 0.00). (B–E) examples of BrdU-labeled cells in the dentate gyrus. (F) Subgranular zone of dentate gyrus, 40× magnification, the arrows demonstrate the BrdU-labeled cells. (G) BrdU-labeled cells in the dentate gyrus, 4× magnification. Scale bar: 25 μm. *p < 0.05; **p < 0.01; ***p < 0.001.

