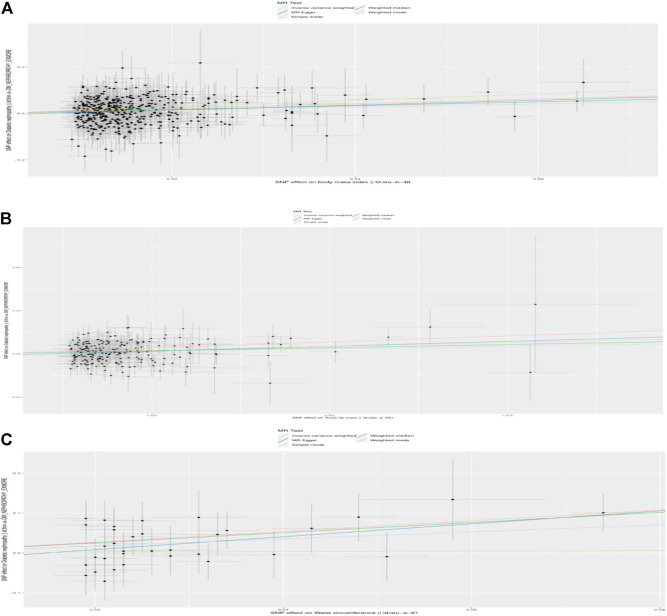
FIGURE 1.
Scatterplot to visualize causal effect of the body mass index (BMI), trunk fat mass, and WC on DKD. (A) Causal effect of BMI on DKD. (B) Causal effect of trunk fat mass on DKD. (C) Causal effect of WC on DKD. The slope of the straight line indicates the magnitude of the causal association. IVW, inverse-variance weighted; MR, Mendelian randomization.

